
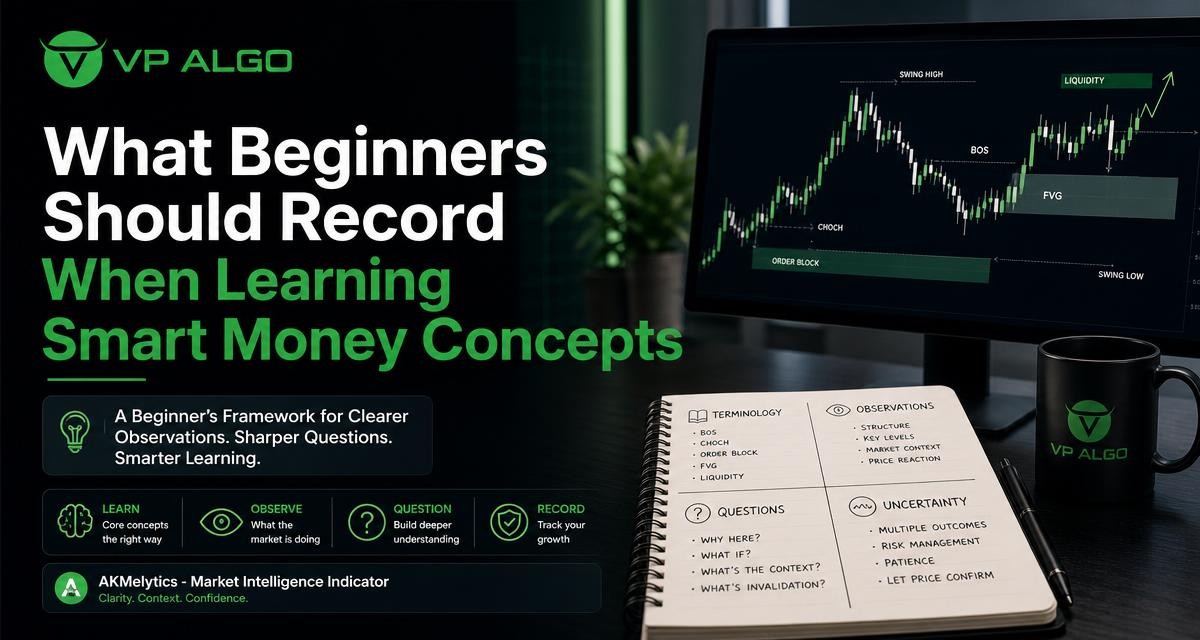
Learning smart money concepts becomes more useful when you record what you see instead of relying on memory or isolated chart examples. A simple journal can help you track terminology, market structure, momentum, institutional activity, questions and uncertainty while you study. If you use a smart money trading indicator, your notes should explain how its information relates to the chart—not treat an indicator reading as a lesson, prediction or guarantee.
Why recording matters when learning smart money concepts
Smart money concepts include a range of ideas about market structure, liquidity, momentum, institutional activity and the way price moves through important areas. Beginners can quickly encounter terms such as swing highs, swing lows, breaks of structure, changes in character, order blocks, liquidity pools and fair value gaps. Without a system for recording them, these terms can become a list of definitions with little connection to actual chart behaviour.
Writing observations also separates what happened from what you expected to happen. That distinction is important in technical analysis. A chart may appear clear after a move has already occurred, while the same chart was less certain beforehand. A good learning record preserves that uncertainty and helps you review your reasoning rather than simply judging yourself by the outcome.
Build a basic learning record before opening a chart
Start with a consistent template. It does not need to be complicated, and it can be kept in a spreadsheet, document or trading journal. The purpose is to create the same structure for each observation so that your notes remain comparable over time.
| Record section | What to write down | Why it helps |
|---|---|---|
| Context | Date, instrument if relevant, chart timeframe and general market condition | Provides the setting for the observation |
| Terminology | The smart money concept being studied and your current definition | Shows whether you understand the term consistently |
| Price action | Relevant highs, lows, ranges, breaks and reactions | Connects the concept to visible chart behaviour |
| Indicator information | What the smart money trading indicator displayed and when | Helps you compare tool output with price structure |
| Questions | What is unclear, conflicting or worth researching | Turns confusion into a specific learning task |
| Uncertainty | What could not be confirmed from the chart | Reduces overconfidence and hindsight bias |
Keep each entry focused on observation and interpretation. For example, write that price formed a higher high after breaking a previous swing level. Then separately state your interpretation, such as whether the move may represent a continuation of the current structure. This makes it easier to revise your interpretation later without rewriting the original observation.
Record terminology in your own words
Terminology is the first area many beginners should document. Rather than copying a definition and moving on, write a short explanation in plain language. Include the conditions that would make the term relevant and the evidence you would expect to see on a chart.
Use a three-part definition
- Meaning: What does the term describe?
- Chart evidence: What price action would support identifying it?
- Limits: What could make the identification uncertain?
For example, when studying a break of structure, record which swing point was broken, whether the break was based on a candle close or an intrabar movement, and whether different timeframes show the same structure. You are not required to settle every interpretation immediately. Recording competing interpretations can be more valuable than forcing one conclusion.
A glossary can also reveal where your vocabulary is becoming too broad. If you use the same term for several different chart situations, note the differences and ask what criteria you are applying. This is particularly helpful for concepts that traders define or label differently.
Document market structure step by step
Market structure gives your notes a sequence. Instead of recording only a final signal, mark the events that led to it. Begin with the visible swing highs and swing lows, then describe whether price is moving through a range, creating a series of higher highs and higher lows, or creating lower highs and lower lows.
Questions for a structure entry
- Which highs and lows are important on the selected timeframe?
- Is price trending, ranging or transitioning between conditions?
- Which level would need to be exceeded before your interpretation changes?
- Was the apparent break decisive, or could it be a temporary movement beyond a level?
- Does a higher timeframe provide a different structural context?
Do not record a structure label without recording the reference point. “Bullish structure” is less useful than “price held the previous swing low and later moved above the prior swing high.” The second version gives you something concrete to review and compare with future examples.
It is also useful to record what would invalidate your current reading. This does not predict the next move. It simply identifies the condition under which your present interpretation would no longer fit the chart.
Separate chart observations from indicator readings
A smart money trading indicator can organise information relating to trend, momentum, market structure, institutional activity and smart money conditions. However, your journal should distinguish between what the chart shows and what the tool displays. This prevents the indicator from becoming a substitute for learning how to read price action.
| Observation type | Example of a useful note | Follow-up question |
|---|---|---|
| Price action | Price moved above a previously marked swing high | Was the move sustained or quickly rejected? |
| Structure interpretation | The move may represent a shift in the short-term sequence | Does the next swing support that interpretation? |
| Indicator display | The indicator highlighted a change in trend or momentum | Did the display align with the structure being studied? |
| Context | Higher timeframe structure appeared less clear | How much weight should the lower-timeframe observation receive? |
| Uncertainty | Several levels could reasonably be marked as relevant | What rule would make the marking more consistent? |
Use neutral language such as “displayed,” “aligned,” “differed,” “followed” or “did not confirm.” Avoid writing that an indicator “knew” what would happen or “proved” a trade idea. A reading is information to evaluate in context, not a replacement for independent judgment.
Track timeframe relationships
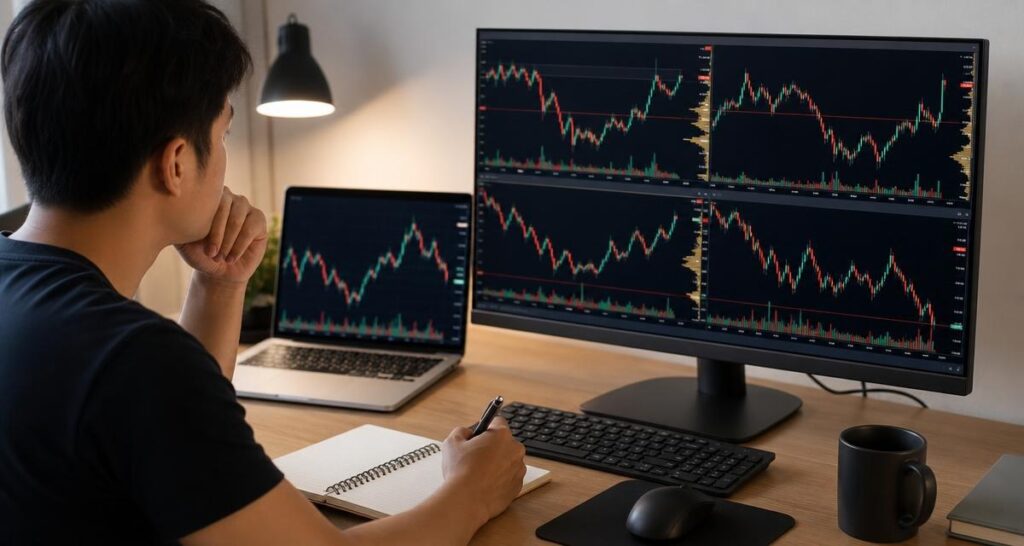
Many smart money concepts look different depending on the timeframe. A movement that appears to be a major break on a short chart may be a small fluctuation inside a broader range. For that reason, record the timeframe used for each observation and, when relevant, note the larger context separately.
A simple multi-timeframe note
- Write the broader structure first: trend, range or unclear condition.
- Mark the important higher-timeframe levels or swing points.
- Describe the lower-timeframe movement without assuming it changes the broader structure.
- Record where the two views agree and where they differ.
- State what remains uncertain rather than resolving the conflict automatically.
This approach helps prevent a short-term signal from being treated as a complete market explanation. It also creates a useful record for reviewing how your interpretation changes as price develops.
Record liquidity and institutional activity carefully
Liquidity and institutional activity can be difficult to observe directly from a chart. When recording these ideas, describe the evidence and the interpretation separately. You might note that price moved through a cluster of previously watched highs, then record that this could be relevant to a liquidity discussion. Avoid presenting an inferred explanation as a confirmed fact.
The same principle applies when an indicator presents information related to institutional flow. Record what the indicator showed, the time it appeared and the surrounding price behaviour. Then ask whether the display was consistent with the market structure you had already identified. This creates a learning record without claiming that an indicator can reveal every participant’s activity or establish the reason for every price movement.
Use questions as the main learning tool
A beginner’s journal should contain questions, not just answers. Questions reveal the difference between recognising a label and understanding how it is used. They also give you a clear agenda for further study.
Useful questions to record
- What exact price action caused me to mark this level?
- Would another reasonable trader mark the same level differently?
- Am I identifying the concept before the movement, or only after it is visible?
- Which timeframe supports this interpretation?
- What evidence contradicts my current view?
- Did the indicator add context, or did it merely repeat what price had already shown?
- What information is missing from this chart?
Keep a separate list of unresolved questions. Revisit it after reviewing more examples, but do not assume that every question has one universal answer. Some terminology varies across educational sources, and some chart situations remain ambiguous even when viewed carefully.
Record uncertainty instead of hiding it
Uncertainty is not a weakness in a learning journal. It is a description of the limits of the evidence available at that moment. You can record uncertainty by assigning a confidence description such as clear, mixed or unclear, provided you explain why you used it.
For example, an entry might say that the short-term structure appeared clear, while the higher-timeframe context was mixed and the significance of an indicator display was uncertain. This is more informative than a simple bullish or bearish label. It also discourages the habit of rewriting a past entry after the market has moved.
Record what you knew, what you inferred and what you did not know at the time. That is the part of the process that can be reviewed and improved.
Review records without turning them into guarantees
Set aside time to review your notes after collecting several examples. Look for repeated misunderstandings, inconsistent definitions and situations where you ignored conflicting evidence. Review whether your observations were specific enough to be checked later.
A review is not proof that a particular concept or indicator will produce a certain result in the future. Markets can behave differently across conditions, and past chart examples do not guarantee future outcomes. The value of the review is educational: it can help you understand your process, refine your questions and identify where more study is needed.
Where an indicator can fit into a learning framework
VP ALGO TRADING develops TradingView indicators and algorithmic trading tools intended to assist with evaluating market conditions. Its Delphi Intelligence Smart Money Indicator includes features related to trend analysis, momentum, market structure, institutional flow monitoring, multi-timeframe trend assessment and smart money analysis.
For a beginner, the most useful role for such a tool is as one information source in a structured review process. Record the indicator’s display alongside your own chart observations, note where they align or differ, and write down the questions that follow. The tool should not replace study, risk awareness or personal decision-making, and it should not be treated as financial advice or a guarantee of trading results.
A practical journal template
You can copy the following headings into each new entry:
- Date and timeframe: When and where was the observation made?
- Market context: Did the chart appear to be trending, ranging or unclear?
- Concept studied: Which smart money concept are you reviewing?
- Price evidence: Which highs, lows, levels or movements are relevant?
- Indicator information: What did the smart money trading indicator display?
- Agreement and conflict: Where did price and the tool align or differ?
- Questions: What needs further explanation?
- Uncertainty: What could not be confirmed?
- Later review: What did you learn when revisiting the entry?
Consistency matters more than the software used to store the template. A short entry completed regularly is generally more useful for learning than a detailed entry that is rarely repeated.
Frequently asked questions
What should a beginner record first when learning smart money concepts?
Begin with the concept’s definition in your own words, the chart evidence supporting it, the timeframe and the uncertainty surrounding the identification. Then record any indicator information separately.
Should I record every signal from a smart money trading indicator?
You do not need to record every display. Choose examples that help you study a specific concept, compare the tool with price structure or investigate a question. Always include the timeframe and surrounding market context.
Can an indicator teach me smart money concepts by itself?
An indicator can organise or display information related to trend, momentum, structure and smart money conditions, but it does not replace learning the terminology or examining price action. Use it as a supporting source rather than as the entire lesson.
How should I record a chart when the structure is unclear?
State that it is unclear, describe the competing interpretations and identify the evidence that prevents a firm conclusion. Recording ambiguity is more useful than forcing a bullish or bearish label.
Why should I separate observations from interpretations?
Separating them helps you see whether your conclusion is supported by specific chart evidence. It also makes it easier to review hindsight bias and change an interpretation without changing the original record.
Does keeping a journal guarantee better trading results?
No. A journal is a learning and review tool, not a guarantee of profits or a way to eliminate trading losses. Its value is in making your reasoning, questions and uncertainty easier to examine.


Recent Comments