
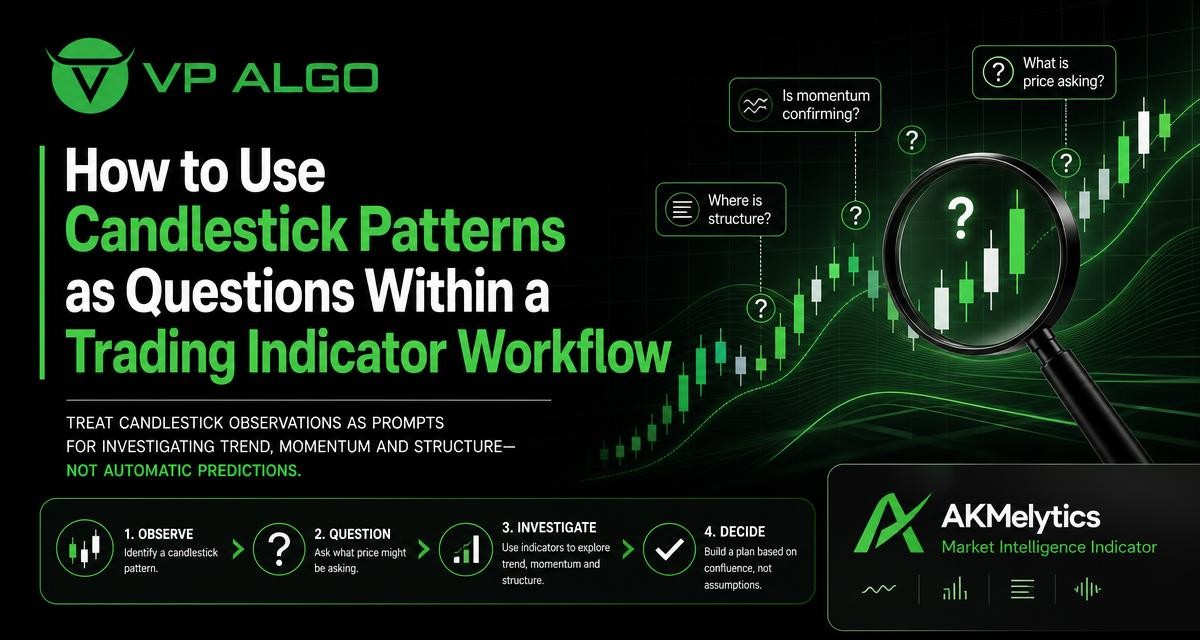
Candlestick patterns can be useful starting points for market analysis, but they are not automatic answers. A hammer, engulfing candle or doji describes how price behaved during a specific period; it does not explain the full trend, the surrounding market structure or what may happen next. A more disciplined approach is to treat candlestick patterns as questions within a broader trading indicator workflow. Instead of asking whether a pattern predicts a buy or sell signal, ask what it suggests about momentum, participation, support, resistance and the quality of the current setup.
Why candlestick patterns should prompt questions
Each candle contains information about the relationship between the open, high, low and close for a chosen timeframe. The body can show the distance between opening and closing prices, while the wicks show where price moved and was rejected during the period. A sequence of candles may reveal acceleration, hesitation, rejection or a change in pressure.
That information is valuable, but it is incomplete on its own. The same candlestick pattern can appear during a strong trend, inside a sideways range or near an important structural level. Its meaning depends on context. A bullish-looking candle in a broader decline may represent a temporary reaction rather than a confirmed reversal. A bearish-looking candle after an extended advance may signal hesitation, but it may also be followed by continued upward movement.
Using patterns as questions encourages a trader to investigate rather than react. The candle becomes the beginning of a process:
- What changed in price behaviour?
- Where did the pattern form in relation to recent highs and lows?
- Does the broader trend support or conflict with the candle?
- Is momentum strengthening, weakening or mixed?
- Is there enough information to define a setup, or is more confirmation needed?
What a candlestick pattern can and cannot tell you
A candlestick pattern can describe visible price action. For example, a long lower wick may show that sellers pushed price lower before buyers regained ground by the close. A large bullish body may show strong movement during that period. Several small bodies may indicate hesitation or compression.
However, the pattern cannot independently establish the cause of that movement. It does not prove that institutions entered the market, confirm that a trend has reversed or determine whether the next candle will continue in the same direction. These are questions that require broader analysis and a defined decision process.
| Observation | Useful question | What to investigate next |
|---|---|---|
| Long wick | Was price rejected from a meaningful area? | Recent swing points, support, resistance and market structure |
| Large candle body | Is momentum expanding or is this an isolated move? | Recent candle range, trend direction and momentum behaviour |
| Small body or doji | Is the market pausing before continuation or showing uncertainty? | Location within the trend and following price response |
| Engulfing candle | Did pressure visibly shift, and does the context support that shift? | Previous trend, structural level and subsequent confirmation |
| Repeated candles in one direction | Is directional pressure sustained? | Trend strength, momentum and possible exhaustion |
Question one: What is the broader trend?
The first question after noticing a candlestick pattern is often the simplest: what direction is the market currently taking? A pattern that appears in alignment with the broader trend may deserve different attention from one that attempts to move against it.
Trend analysis does not require assuming that every pullback will continue or that every reversal will fail. It provides a working context. Look at the sequence of relevant highs and lows, the direction of price movement across the selected timeframe and whether recent swings are expanding or losing force. A bullish pattern during a series of higher highs and higher lows may be a continuation prompt. The same pattern during lower highs and lower lows may instead raise the question of whether a genuine structural change has occurred.
A trend indicator can help organize this observation, particularly when several timeframes are being reviewed. It should not replace the chart itself. The useful question is not simply whether an indicator is green or red, but whether its reading agrees with the price structure visible on the chart.
Question two: Where did the pattern form?
Location often matters more than the name of a candlestick pattern. A rejection candle in the middle of an undifferentiated range may offer limited information. A similar candle near a recent swing high, swing low or clearly watched area may deserve closer examination because the market has reached a point where buyers and sellers have previously responded.
Market structure provides a framework for this investigation. Mark recent highs and lows, identify whether price is making meaningful progress or remaining range-bound, and note whether the pattern forms after a test, breakout attempt or sharp displacement. The goal is not to label every candle as a support or resistance event. It is to determine whether the pattern appears at a location where a change in behaviour would be relevant.
Questions for structural context
- Is the candle near a recent swing high or swing low?
- Has price returned to an area it previously moved away from quickly?
- Did the pattern form after a breakout, pullback or failed breakout?
- Does the candle challenge the current sequence of highs and lows?
- Is the market trending clearly, or is it moving inside a range?
A market structure indicator can make these observations easier to review, but the indicator output still needs to be interpreted alongside the actual price sequence. Labels and markers are prompts for inspection, not substitutes for inspection.
Question three: What is momentum doing?
Candlestick patterns often attract attention because they show a sudden change in movement. The next step is to ask whether momentum supports that change. A large candle may represent genuine expansion, but it may also be an isolated reaction after an extended move. A series of smaller candles may indicate a pause, or it may show that directional pressure is fading.
Momentum analysis can include the size and speed of recent price moves, the consistency of closes and the relationship between current movement and prior movement. When a candlestick pattern points upward but momentum is weakening, the observation becomes a cautionary question: is the move sustainable, or is price struggling to continue? When the pattern and momentum agree, the setup may deserve further review, though agreement is not a guarantee of a particular outcome.
A momentum indicator can provide a repeatable way to assess this dimension. It is useful to compare the indicator reading with the candle sequence rather than use it in isolation. For example, ask whether momentum is expanding in the same direction as the candle, diverging from price or simply oscillating within a range.
Question four: Is there evidence of a change in pressure?
Some traders use candlestick patterns to look for a shift between buying and selling pressure. This can be a reasonable area of investigation, but the language should remain careful. A candle may suggest rejection or increased participation; it does not prove the identity or intentions of every market participant.
Within a smart money or institutional-flow analysis workflow, a candlestick observation can be compared with broader signals related to structure, momentum and possible activity. The purpose is to look for agreement across different forms of evidence. A rejection candle that also appears near a structural level and alongside a meaningful change in momentum may deserve more attention than the same candle appearing without supporting context.
This approach avoids treating a single candle as proof of institutional activity. Instead, it asks whether several observations point to a consistent interpretation and whether the interpretation remains valid on the selected timeframe.
Question five: Does the higher timeframe agree?
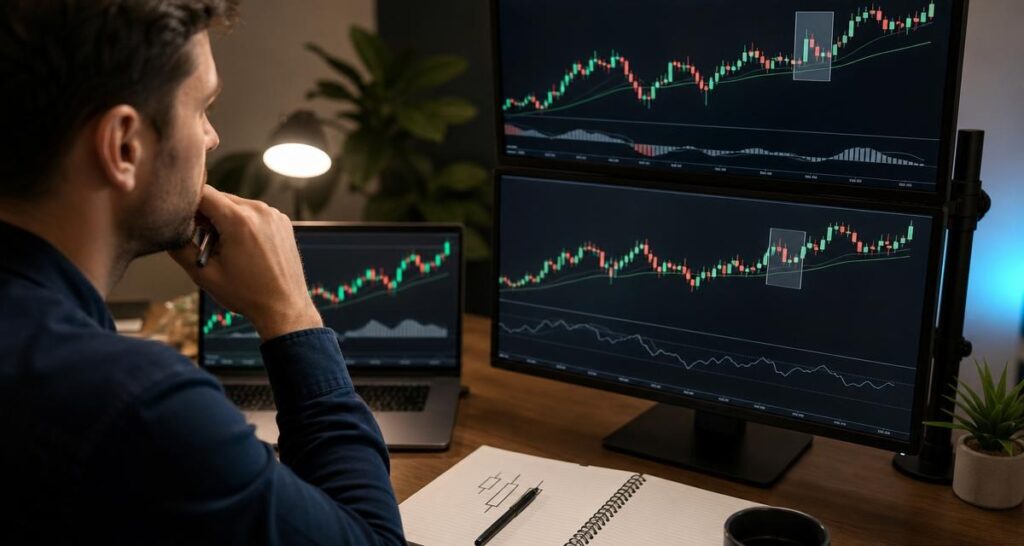
A pattern can look convincing on a short timeframe while appearing insignificant on a higher one. This is why multi-timeframe review can be useful. Start with the timeframe that defines the broader context, then examine the lower timeframe for detail. The higher timeframe can help answer whether the pattern is occurring with the prevailing direction, against it or inside a larger consolidation.
For example, a bullish candle on a lower timeframe may be part of a pullback within a broader uptrend, a temporary reaction inside a larger downtrend or simply movement within a range. These possibilities cannot be separated by the candle name alone. Reviewing multiple timeframes helps frame the observation and reduces the temptation to give excessive importance to a short-term pattern.
| Review level | Main question | Typical role in the workflow |
|---|---|---|
| Higher timeframe | What is the broad directional and structural context? | Defines the larger market environment |
| Working timeframe | What is the current trend and momentum condition? | Organizes the main analysis |
| Lower timeframe | How is price behaving around the area of interest? | Adds detail without replacing the broader context |
There is no single timeframe combination that suits every trader or market. The key is to use a consistent review process and record how the different views relate to one another.
Building a candlestick patterns workflow with a trading indicator
A trading indicator can help structure the questions that follow a candle observation. The goal is not to create a chain of automatic predictions. It is to reduce scattered chart reading by giving each part of the analysis a defined place.
Step 1: Describe the candle without predicting
Begin with an objective description. Note whether the candle has a long wick, a large or small body, a close near an extreme or a relationship to the preceding candles. Avoid immediately calling it a buy signal, sell signal or reversal. This first step separates observation from interpretation.
Step 2: Record the structural location
Identify the nearby swing points, range boundaries or areas where price recently reacted. Ask whether the candle is testing an important part of the chart. If the location is unclear, the pattern may not deserve a strong interpretation yet.
Step 3: Check trend and momentum
Use the available trend and momentum information to determine whether the candle is aligned with current conditions. Note agreement, conflict or uncertainty. A conflicting reading is not automatically a reason to reject the observation, but it should prevent overconfidence.
Step 4: Review broader activity and structure
If the workflow includes smart money concepts, institutional-flow observations or market structure tools, compare them with the candle. Look for a coherent picture rather than a collection of isolated labels. Where the signals disagree, record the disagreement instead of forcing a conclusion.
Step 5: Define what would confirm or invalidate the idea
A useful analysis includes conditions that would change the interpretation. These might involve a break of a recent swing, failure to hold an area, continuation in the opposite direction or a loss of momentum. Defining these conditions before acting can make the review more consistent and easier to evaluate later.
Common mistakes when reading candlestick patterns
Giving the pattern a fixed meaning
Pattern names are convenient descriptions, not universal instructions. Treating a hammer or engulfing candle as inherently bullish or bearish ignores the location and prevailing conditions. Ask what the pattern means in this chart, on this timeframe and within this structure.
Ignoring the preceding move
A candle cannot be separated from the movement that came before it. A reversal-shaped candle after a brief decline may have a different significance from the same shape after a prolonged directional move. Always review the sequence rather than focusing on one bar.
Using too many indicators without a decision structure
Adding more indicators does not automatically improve analysis. If every tool produces a different prompt, the result may be confusion rather than confirmation. Assign each tool a purpose, such as trend, momentum, structure or activity, and avoid counting several versions of the same information as independent evidence.
Confusing confirmation with certainty
When a candle, trend reading and momentum reading agree, they may create a more coherent scenario. They still do not make the outcome certain. Markets can change, signals can conflict and an apparent setup can fail. A structured workflow improves discipline; it does not remove uncertainty or trading risk.
Changing the process after every outcome
One successful or unsuccessful pattern should not determine the entire method. Keep notes about the context, the questions asked and the conditions that followed. Reviewing a series of observations can reveal whether the workflow is being applied consistently and where its assumptions need examination.
How AKMelytics can fit this analytical approach
AKMelytics – Market Intelligence Indicator is designed for traders who want a more structured way to examine market conditions on TradingView. The business describes its indicator offering in terms of trend analysis, momentum evaluation, market structure, institutional activity and smart money analysis. Those areas correspond naturally with the questions that arise after identifying a candlestick pattern.
Used responsibly, an indicator can help bring separate observations into one review process. A trader might begin with the candle, assess the broader trend, examine momentum, review market structure and then consider whether activity-related information supports or challenges the initial interpretation. The indicator should be treated as an analysis aid rather than an automatic prediction engine or replacement for individual judgment.
Because market conditions change, the same candlestick pattern should not be expected to produce the same result every time. The value of a workflow is its repeatability: it gives the trader a consistent sequence of questions and a clearer record of why a chart received attention.
A practical review checklist
Before assigning significance to a candlestick pattern, work through a short checklist. The checklist can be adapted to a personal trading plan and should be tested through careful observation rather than assumed to be universally suitable.
- Describe the candle and the preceding price sequence.
- Identify the current market structure and nearby swing points.
- Determine whether the broader trend is rising, falling or ranging.
- Review momentum and note whether it agrees with the candle.
- Compare the working timeframe with a higher timeframe.
- Consider whether activity or smart money observations add relevant context.
- Write down what would confirm, weaken or invalidate the interpretation.
- Record the reasoning without presenting the result as guaranteed.
This process keeps the focus on investigation. It also makes it easier to distinguish a well-defined observation from a reaction driven by the visual appeal of a familiar pattern.
Final perspective: use candles to investigate, not predict automatically
Candlestick patterns are most useful when they open an analytical conversation. They can draw attention to rejection, expansion, hesitation or a possible change in pressure, but they cannot provide complete market context by themselves. Trend, momentum, structure, timeframe and activity all influence how a pattern should be understood.
A trading indicator can support this process by organizing those dimensions into a repeatable workflow. The strongest habit is to ask better questions: What is price doing? Where is it doing it? Does momentum agree? Does the broader structure support the observation? What evidence would change the view? This approach keeps technical analysis grounded in context and avoids presenting a single candle as a promise about the next market move.
Frequently Asked Questions
Are candlestick patterns reliable on their own?
No. Candlestick patterns describe price behaviour, but their interpretation depends on trend, market structure, timeframe and momentum. They are better treated as prompts for further analysis than as standalone predictions.
What should I check after finding a candlestick pattern?
Check the pattern’s location, the broader trend, recent swing points, momentum and the higher-timeframe context. Also consider what conditions would confirm or invalidate the initial interpretation.
Can a trading indicator confirm a candlestick pattern?
A trading indicator can provide additional context about trend, momentum, structure or activity. It cannot guarantee that a pattern will succeed. Its role is to support a consistent review process, not to remove uncertainty.
Why does the same candlestick pattern produce different results?
The surrounding conditions may be different. A pattern near a structural level can have a different meaning from one in the middle of a range, and a pattern aligned with a broader trend differs from one opposing it.
How does multi-timeframe analysis help with candlestick patterns?
It shows whether a short-term pattern agrees with or conflicts with the larger market context. This can help prevent a lower-timeframe candle from being given more importance than the broader structure supports.
Can AKMelytics automatically predict the next market move?
No indicator should be presented as an automatic predictor of future market outcomes. AKMelytics can be used as an analytical aid for reviewing trend, momentum, market structure and related market conditions, while decisions remain subject to uncertainty and risk.


Recent Comments