
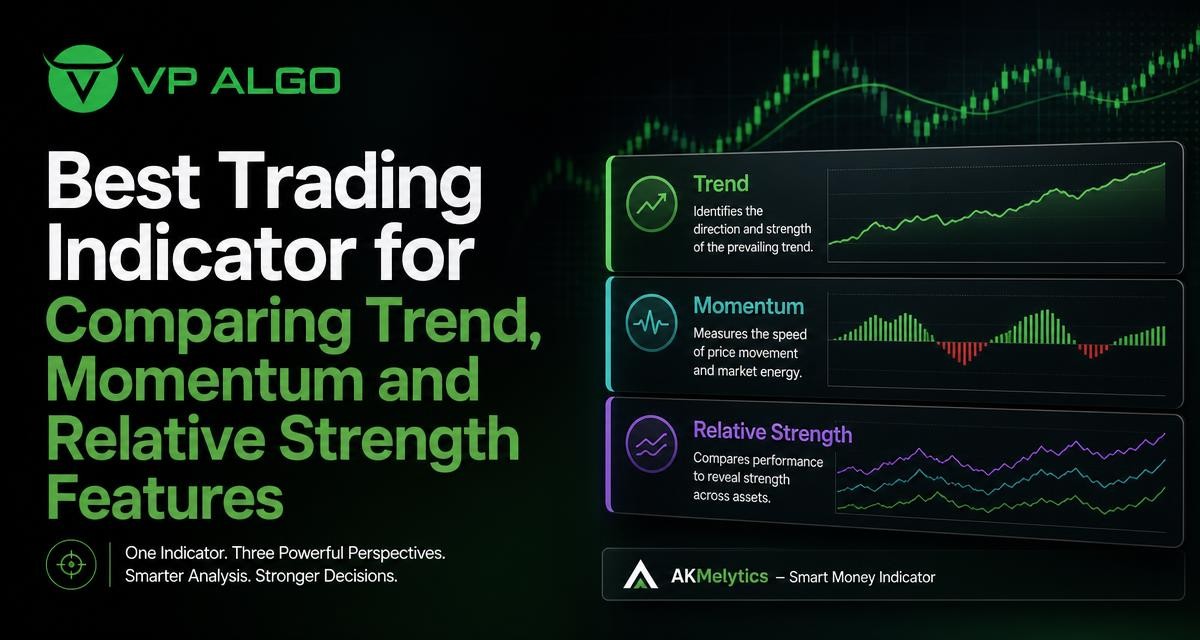
Choosing the best trading indicator is less about finding one perfect signal and more about understanding what each feature measures. Trend analysis can show directional bias, momentum can indicate the strength behind a move, and relative strength can help compare performance or pressure across markets. When these observations are viewed alongside market structure and smart money concepts, traders may develop a more organised way to study potential setups on TradingView.
What makes a trading indicator useful?
A trading indicator is useful when it answers a specific analytical question. For example, a trend feature may help you ask whether price is moving consistently in one direction. A momentum feature may help you examine whether that move is gaining or losing force. A market structure feature can provide context about swing points and structural events, while a relative strength feature can help identify which asset or market is showing comparatively stronger behaviour.
The most useful tool depends on your trading process, the information you need and the way you interpret charts. An indicator that combines several analytical features may reduce the need to move between unrelated tools, but it does not remove the need for independent judgement, risk awareness or a defined trading plan. Indicators support analysis; they do not guarantee a particular outcome.
Trend, momentum and relative strength answer different questions
Trend, momentum and relative strength are often discussed together, but they describe different aspects of market behaviour. Treating them as interchangeable can lead to unclear chart analysis. A better approach is to understand the role of each feature before deciding how the observations may complement one another.
| Feature | Main question | What it may add to analysis | Potential limitation |
|---|---|---|---|
| Trend | What direction is price generally following? | Directional context and a way to assess whether price is moving persistently | May react slowly after a reversal or change in market conditions |
| Momentum | How strong or persistent is the current price movement? | Information about acceleration, weakening pressure or continuation attempts | Strong momentum can also occur near an exhausted move |
| Relative strength | How does one market or instrument behave compared with another reference? | A way to compare performance or identify relative leadership and weakness | Results depend on the comparison selected and the timeframe used |
| Market structure | How are swing points and structural events developing? | Context for breaks, changes of character and possible shifts in direction | Structure can be interpreted differently across timeframes |
| Smart money concepts | What clues may indicate changes in market flow or institutional-style activity? | Additional context around flow, structure and potential areas of interest | Concepts still require confirmation and should not be treated as certainty |
How to compare trend features
Trend direction and trend consistency
A trend feature is usually most helpful when it gives the chart a broad directional framework. Instead of looking only for an upward or downward label, consider whether price is forming a sequence that supports that direction and whether the signal is consistent across the timeframe you are analysing.
A trend reading can provide context for the rest of the chart. For instance, a trader may give more attention to bullish momentum observations when the broader trend assessment is also positive. That does not make every bullish signal valid, but it can help separate a potential continuation idea from a setup that is moving directly against the prevailing direction.
Multi-timeframe trend assessment
Trend can look different depending on the chart timeframe. A shorter-term pullback may appear bearish on a lower timeframe while the broader structure remains constructive on a higher timeframe. This is why multi-timeframe trend assessment can be useful: it allows traders to examine whether a local movement fits, challenges or completely contradicts the wider market context.
A TradingView indicator with multi-timeframe features can place that context in one analytical workflow. The important question is not whether every timeframe agrees perfectly. Markets can move through transitions. The useful question is whether the difference between timeframes is understood before a trading decision is considered.
How to compare momentum features
Momentum is more than a buy or sell label
When evaluating a momentum indicator for TradingView, look beyond simple signal markers. Momentum analysis is concerned with the force and persistence of price movement. A move may be trending upward but losing momentum, or it may be emerging from a period of low activity and beginning to gain strength.
Momentum observations may help traders consider whether a move is developing, continuing or weakening. They can also provide a second layer of context when price approaches an important structural level. For example, a break accompanied by stronger momentum may deserve different attention from a break that occurs while momentum is fading. Neither observation confirms a successful trade by itself.
Momentum and false confidence
Strong momentum can be informative, but it should not automatically be treated as a reason to enter a position. Markets can move quickly before reversing, particularly when price has already travelled a significant distance. Momentum is therefore best considered alongside trend direction, market structure, volatility and the trader’s predefined risk process.
A well-organised chart should make it clear whether momentum is being used as a filter, a confirmation tool or a way to monitor an existing idea. Mixing these roles without a plan can result in repeated or conflicting signals.
How relative strength adds comparison
Relative strength examines behaviour in relation to another instrument, market or reference. This is different from asking whether price is rising or falling in isolation. Two assets may both be moving higher, yet one may be showing stronger performance. Similarly, an asset that is declining less than its comparison may be displaying relative resilience even while its own price remains weak.
Relative strength can help traders organise attention. Rather than reviewing every chart equally, they may use comparative observations to identify markets that appear stronger or weaker within the group being studied. The result depends on the reference, timeframe and calculation used, so relative strength should be interpreted as a comparison rather than an absolute verdict.
Relative strength and trend context
Trend and relative strength can complement one another. Trend describes the direction of an individual market, while relative strength places that behaviour in a broader comparison. A market with a positive trend but declining relative strength may require more careful review. Conversely, improving relative strength during an emerging trend may suggest that the market deserves further analysis.
These observations remain descriptive. They do not establish that a market will continue to outperform or that a particular setup will be profitable. Their value comes from helping traders ask better questions before applying their own rules.
Why market structure matters in the comparison
Trend and momentum readings can become difficult to interpret without structural context. Market structure focuses on the arrangement of swing highs, swing lows and significant changes in price behaviour. Events such as a break of structure, often called BOS, or a change of character, often called CHoCH, can help traders describe how the current price sequence is developing.
Structure features may help distinguish a continuation attempt from a possible transition. For example, momentum may be increasing, but the trader still needs to consider whether price is breaking a meaningful structural point or simply moving within an established range. The timeframe also matters: a structural event on a shorter chart may not alter the broader market structure.
Structure is context, not certainty
Terms such as BOS and CHoCH are analytical descriptions, not guarantees of a future direction. Different traders may define significant swings differently, and a market can produce failed breaks. A useful market structure indicator should therefore be treated as a way to organise observations rather than an automatic decision-maker.
Where smart money and market flow features fit
Smart money concepts and market flow features add another layer to the analysis. They are intended to help traders examine potential changes in participation, flow or institutional-style activity as part of a wider chart review. These features can be especially relevant to traders who want to combine price structure with an assessment of where pressure may be developing.
The term “smart money” should not be interpreted as proof that a specific institution has entered or exited a market. An indicator can present calculated observations and contextual signals, but it cannot provide private knowledge of every participant’s activity. The responsible use of these features involves treating them as analytical input and looking for agreement with the rest of the chart.
Comparing single-purpose and combined indicators
A single-purpose indicator may be appropriate when you want a focused answer, such as a simple momentum reading or a dedicated trend assessment. Its narrow scope can make the chart easier to understand. However, using several separate tools may create duplicated signals, different settings and a crowded workspace.
A combined TradingView trading indicator takes a broader approach. The AKMelytics – Smart Money Indicator from VP ALGO TRADING is described as combining momentum, trend analysis, market structure, market flow, relative strength and smart money concepts. Its features also include multi-timeframe analysis, BOS and CHoCH events, Fibonacci projections, volatility-based target and risk reference levels, dashboard context and configurable TradingView alerts.
That combination may be useful for traders who want to review several dimensions of market behaviour in one framework. It does not mean that every feature should be used at once or that a larger feature list automatically makes an indicator better. The right comparison is whether the tool supports a clear, repeatable analysis process.
| Comparison question | Why it matters |
|---|---|
| Does the indicator show more than one type of market information? | Trend, momentum, structure and relative strength answer different questions and may provide broader context together. |
| Can the features be interpreted separately? | Separate readings make it easier to understand which observation is supporting or challenging an idea. |
| Does it support multiple timeframes? | Different timeframes can reveal whether a shorter-term move fits the broader market context. |
| Are alerts configurable? | Configurable alerts may help traders monitor selected conditions without treating every alert as a trade instruction. |
| Does it provide risk or target references? | Reference levels can assist planning, but they should not be mistaken for guaranteed outcomes or personalised advice. |
| Can the chart remain understandable? | A tool is less useful if too many signals make the decision process harder to follow. |
A practical process for evaluating a trading indicator
Before deciding whether an indicator is suitable, test how it fits into your own method of analysis. The objective is not to collect the largest number of signals. It is to determine whether the information helps you make consistent observations and document why a setup is being considered.
- Start with the broad trend. Identify the directional context on the timeframe that matters most to your analysis.
- Review market structure. Examine relevant swing points, breaks of structure and possible changes in character.
- Check momentum. Ask whether price movement is strengthening, weakening or showing conflicting evidence.
- Compare relative strength. Consider how the instrument behaves against the chosen reference rather than viewing it in isolation.
- Review flow and smart money context. Treat these observations as additional evidence, not as certainty about market participants.
- Define the decision rule. Decide in advance which combination of observations is required before an idea is reviewed further.
- Record the reasoning. A trading journal can help distinguish a repeatable process from decisions made after the fact.
This process is educational and analytical rather than financial advice. Every trader remains responsible for understanding the tool, considering risk and deciding whether a particular method is appropriate for their circumstances.
Common mistakes when searching for the best trading indicator
Choosing a tool because it has the most signals
More signals do not necessarily create better analysis. A crowded chart can encourage traders to react to every marker instead of evaluating the overall market context. Prioritise clarity: each feature should have a defined purpose in your workflow.
Confusing confirmation with prediction
When several readings agree, the setup may appear more convincing, but agreement does not predict the future with certainty. Indicators are based on market data and analytical rules. They can support a decision process while still producing signals that fail.
Ignoring timeframe differences
A bullish reading on one timeframe and a bearish reading on another are not automatically errors. They may describe different parts of the same market movement. Before acting on a signal, identify which timeframe controls your broader bias and how the shorter-term observation fits within it.
Using reference levels as fixed outcomes
Fibonacci projections, volatility-based target references and risk levels can help structure a chart review. They are reference points, not promises that price will reach a target or remain within a calculated risk boundary. Market conditions can change after the levels are displayed.
Is AKMelytics a suitable choice for this comparison?
AKMelytics – Smart Money Indicator may be relevant to traders who want a TradingView tool that brings trend, momentum, relative strength, market structure, market flow and smart money analysis into one framework. Its multi-timeframe features, structural events, dashboard context and configurable alerts may help organise chart review for users who prefer a broader analytical view.
Suitability still depends on how you trade and which information you genuinely use. A beginner may benefit from learning each feature separately before combining them, while a more experienced trader may focus on configuring the tool around an existing process. VP ALGO TRADING positions its indicators as support for analysis and trading decisions, not as financial advice or a guarantee of results.
Final considerations
The best trading indicator is not necessarily the one with the longest feature list or the most prominent buy and sell markers. It is the tool that helps you answer relevant questions in a consistent way. Trend can provide direction, momentum can describe the force of movement, relative strength can add comparison, and market structure can place those observations in sequence.
A combined tool such as AKMelytics can bring these areas together for TradingView users who want a structured charting workflow. The strongest approach is still selective and disciplined: understand what each feature measures, test how the readings interact, and use the result as part of a broader decision process rather than as a promise of future performance.
Frequently asked questions
What is the best trading indicator for trend and momentum analysis?
There is no universally best indicator for every trader. A useful choice is one that clearly presents the trend and momentum information you need and fits a defined analysis process. Combined tools may be helpful when you want to examine several related features together.
What is a momentum indicator for TradingView used for?
A momentum indicator for TradingView is used to examine the strength, persistence or weakening of price movement. It can provide context around a developing move, but it does not guarantee that the move will continue.
How is relative strength different from a trend indicator?
A trend indicator generally examines the direction of an individual market. Relative strength compares that market with another instrument or reference, helping traders assess comparative performance or weakness.
What do BOS and CHoCH mean in market structure analysis?
BOS commonly refers to a break of structure, while CHoCH commonly refers to a change of character. They are used to describe structural events in price action and should be interpreted in the context of the timeframe and swing points being analysed.
Can a smart money indicator predict profitable trades?
No indicator can guarantee profitable trades or eliminate losses. Smart money features may provide additional context about market flow and structure, but they should be combined with independent analysis and appropriate risk awareness.
Does AKMelytics provide financial advice?
No. AKMelytics is presented as a TradingView technical analysis tool designed to support market analysis and trading decisions. It is not a financial adviser and does not provide official financial advice.


Recent Comments