
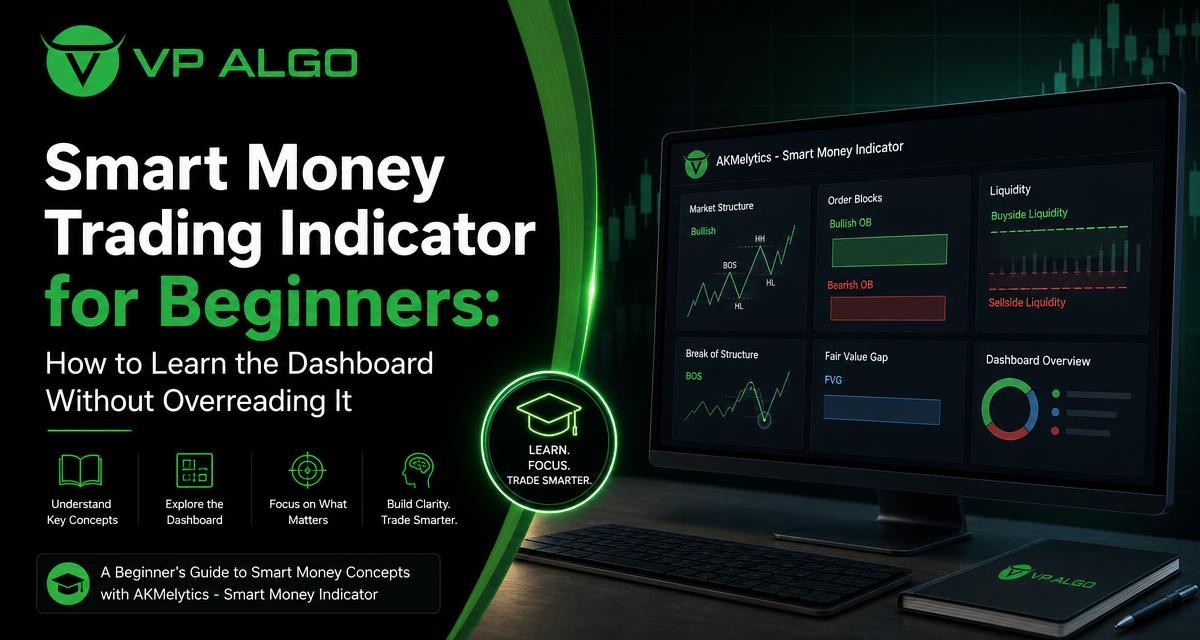
A smart money trading indicator can give beginners a structured way to study trend, momentum, market structure and other chart information. The challenge is learning what each dashboard element means without treating every label, alert or colour as a complete trading decision. A staged learning process helps you read the tool as an analysis aid, compare its information with price action and build understanding through repeated chart reviews.
What a smart money trading indicator is designed to do
Smart money concepts generally focus on the relationship between price movement, market structure, momentum and areas where larger market participants may have influenced activity. In practice, an indicator cannot show you the private intentions of institutions. Instead, it processes observable chart data and presents interpretations that may help you examine trend direction, structural changes, relative strength, momentum and market flow.
AKMelytics – Smart Money Indicator is a TradingView technical analysis tool that brings several of these areas into one viewing experience. Its stated features include multi-timeframe analysis, trend and momentum evaluation, market structure events such as BOS and CHoCH, Fibonacci projections, volatility-based target and risk reference levels, dashboard context and configurable alerts.
That combination can be useful, but it also creates a common beginner problem: too much information at once. The objective is not to read every panel immediately. It is to identify which information answers your current question and temporarily ignore the rest.
Why beginners can overread an indicator dashboard
A dashboard may display trend direction, momentum conditions, structure events, relative strength, market flow and information from more than one timeframe. Each element can appear meaningful on its own. When several elements change at different times, however, a new trader may start searching for certainty where the tool is only showing different aspects of market behaviour.
For example, a higher timeframe may still show an upward trend while a lower timeframe experiences a pullback. Momentum may weaken without the broader structure changing. A BOS or CHoCH event may mark an important structural development, but it does not automatically determine whether a trade should be opened. Learning to separate observation from decision-making is one of the most important skills when using a smart money trading indicator.
A staged learning plan for the dashboard
Stage one: Learn the dashboard layout
Begin by identifying where the main pieces of information appear. Do not try to memorise every setting or interpret every alert. Instead, make a simple inventory of the dashboard:
- Which section describes trend?
- Where are momentum or relative-strength readings shown?
- Where can market structure events be identified?
- Which information comes from another timeframe?
- Which levels are projections or reference levels rather than confirmed outcomes?
- Which alerts can be configured?
At this stage, the goal is familiarity. Open historical charts and note where the dashboard presents information during an obvious trend, a pullback and a period of sideways movement. You are learning the visual language of the tool before attempting to use it as part of a trading process.
Stage two: Separate trend from momentum
Trend and momentum are related, but they are not identical. Trend analysis describes the broader direction or bias visible in price movement. Momentum describes the strength or pace of movement and can change before the broader trend changes.
A chart may therefore show an upward trend while momentum is slowing. That combination does not automatically mean the trend has ended. It may indicate consolidation, a pullback or a transition that requires more observation. When studying the dashboard, write down these two questions separately: “What direction has price been developing in?” and “How strong is the current movement?” Keeping the questions separate reduces the temptation to treat one weakening reading as a complete reversal signal.
Stage three: Learn market structure terms
Market structure gives you a way to describe how price has been forming highs, lows and breaks. Two terms that often appear in smart money concepts are BOS and CHoCH.
- BOS: Break of Structure. This generally refers to price breaking a relevant structural high or low and may be used to describe continuation or a meaningful structural break, depending on the context.
- CHoCH: Change of Character. This is commonly used to describe a possible shift in the behaviour of price structure.
These labels are not substitutes for context. Before interpreting a BOS or CHoCH, check which timeframe produced it, which swing points are being used and whether the move is supported by the surrounding price action. A small lower-timeframe event can occur inside a larger higher-timeframe trend without changing the broader market structure.
Stage four: Add multi-timeframe context
Multi-timeframe analysis can help beginners avoid reading a single chart interval in isolation. A higher timeframe may provide context for the broader trend, while a lower timeframe may show the current setup developing. The precise timeframes you study should fit your own analytical process; there is no single combination that applies to every trader or market situation.
Use a simple top-down sequence. First, ask what the broader chart is doing. Next, examine whether the intermediate chart supports or challenges that view. Finally, use the lower timeframe to observe detail rather than to force a trade. If the dashboard shows conflicting conditions across timeframes, record the conflict instead of immediately trying to resolve it with another indicator setting.
Stage five: Study projections and reference levels
Fibonacci projections and volatility-based target or risk reference levels can help organise chart analysis. They should be treated as analytical references, not as guaranteed destinations or instructions to enter a position. A projected level is still dependent on future price movement, market conditions and the assumptions behind the calculation.
When reviewing these levels, ask what they are helping you measure. Are they showing possible areas to monitor? Are they helping you compare the size of a move with recent volatility? Are they being used to plan an invalidation point in a separate trading process? These questions are more useful than assuming that a displayed level will necessarily be reached.
How to read the main dashboard elements
| Dashboard element | What it may help you examine | What it does not prove |
|---|---|---|
| Trend analysis | The prevailing directional context on the selected chart or timeframe | That price must continue in the same direction |
| Momentum signals | The strength or pace of recent movement | That weakening momentum guarantees a reversal |
| Market structure | Breaks, shifts and relationships between important highs and lows | That one BOS or CHoCH event is sufficient for a trade decision |
| Market flow or institutional activity context | Chart-based information intended to help assess buying or selling pressure | Direct knowledge of institutional intentions or positions |
| Multi-timeframe view | Whether conditions agree or differ across selected timeframes | That all timeframes must point in the same direction |
| Fibonacci and volatility reference levels | Potential areas for measurement, planning or monitoring | Guaranteed targets, entries or outcomes |
| Alerts | Notifications when configured conditions occur | That an alert removes the need for review and judgment |
A practical chart-review routine for beginners
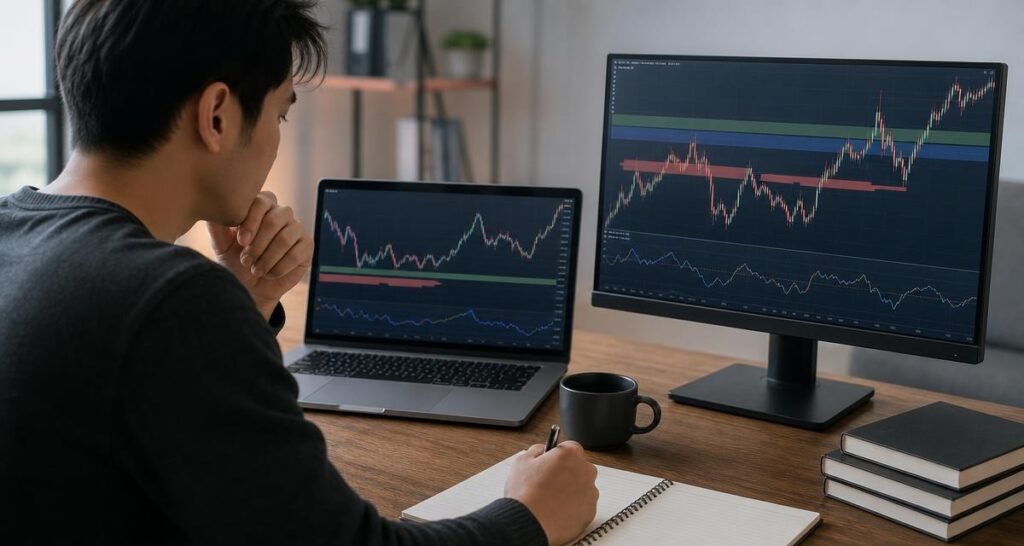
Repeated chart reviews are more valuable when each review has a defined purpose. Rather than scrolling through charts and collecting every signal, use a short routine that separates description from interpretation.
- Describe the broader context. Record whether price appears to be trending, pulling back, consolidating or moving unevenly.
- Check the higher-timeframe view. Note whether it supports, contradicts or provides no clear context for the chart you are studying.
- Review structure. Mark the relevant highs, lows, BOS events or CHoCH events and identify the timeframe associated with each observation.
- Review momentum. Ask whether momentum is strengthening, weakening or mixed, without treating the reading as a standalone instruction.
- Inspect reference levels. Note Fibonacci projections and volatility-based levels as areas to monitor rather than predetermined outcomes.
- Write a neutral conclusion. For example, describe the chart as “higher-timeframe trend is upward, lower-timeframe momentum is weaker and structure is not yet clear.”
This process teaches you to use the dashboard as a framework for questions. It also creates a record that you can revisit later, which is more informative than judging an indicator by one isolated chart or one memorable signal.
Common mistakes when learning a smart money trading indicator
Treating every dashboard item as a separate signal
A dashboard is often designed to organise related information, not to provide a collection of independent trade instructions. Trend, momentum and structure may describe the same price movement from different perspectives. Counting them as separate confirmations can create false confidence.
Changing settings after every disappointing reading
Frequent setting changes make it difficult to understand what the indicator is actually showing. Learn the default display first, keep a record of the configuration you use and change one element at a time when you have a clear reason to do so.
Ignoring timeframe differences
A lower-timeframe shift can look dramatic while remaining part of a higher-timeframe pullback. Always identify the timeframe behind an observation before comparing it with another dashboard reading.
Confusing an alert with a complete plan
Configurable alerts can help you monitor conditions, but a notification does not explain the broader context, risk, liquidity or suitability of a potential decision. Use alerts to prompt review, not to replace it.
Assuming smart money language means certainty
Terms such as institutional flow and smart money concepts can make an analysis sound more precise than the underlying evidence allows. A chart-based indicator can organise observable information and calculations, but it cannot guarantee knowledge of what large market participants will do next.
How to build a useful learning journal
A simple journal can turn repeated chart reviews into a more disciplined learning process. For each review, record the date, instrument or chart being studied, selected timeframe, dashboard settings and the conditions you observed. Then write a short explanation of what the dashboard suggested and what price subsequently did, without changing the original notes.
Focus on process questions rather than only on whether a hypothetical direction was correct. Did you identify the correct timeframe? Did you confuse momentum with trend? Did you rely on one label while ignoring conflicting context? Did the dashboard help you ask a clearer question? These observations can reveal misunderstandings that a string of unstructured chart screenshots may conceal.
Using AKMelytics as an analysis aid
AKMelytics – Smart Money Indicator is intended to support technical analysis and decision-making through its combination of trend analysis, momentum, market structure, market flow, relative strength, smart money concepts and multi-timeframe context. Beginners may find the combination useful because it places several analytical categories in one TradingView environment.
The most productive way to approach it is as a structured workspace. Learn each section separately, compare dashboard information with the chart and keep expectations realistic. The indicator is not a financial adviser and does not provide financial advice. It does not guarantee profitable results, remove trading losses or replace a trader’s own review of risk and market conditions.
If you use the available trial or obtain access to the indicator, reserve the first part of that period for learning the display rather than judging it from a small number of outcomes. Installation, activation or usage questions can be directed to the company’s support process, as the product information states that access is connected with a TradingView ID after purchase.
When you are ready to use the dashboard in a process
You are better prepared when you can explain the dashboard without relying on vague labels. You should be able to describe the difference between trend and momentum, identify the timeframe behind a structure event, explain what a reference level represents and list the information that remains uncertain.
Only then should the indicator become one part of a clearly defined analysis process. That process should include your own criteria for reviewing a chart, managing uncertainty and deciding when information is insufficient. A smart money trading indicator can make chart study more organised, but it should not encourage rushed decisions or the belief that a dashboard can predict every market move.
Frequently asked questions
What is a smart money trading indicator?
It is a chart-based technical analysis tool that presents information related to market structure, trend, momentum, market flow and smart money concepts. It helps organise analysis but cannot guarantee future price movement.
Is a smart money trading indicator suitable for beginners?
It can be useful for beginners who learn it gradually and treat it as an educational analysis aid. Starting with the dashboard layout, trend and structure is usually more practical than trying to interpret every feature at once.
What do BOS and CHoCH mean?
BOS commonly means Break of Structure, while CHoCH commonly means Change of Character. They describe possible developments in price structure and should always be considered with timeframe and surrounding price context.
Should beginners follow every dashboard alert?
No. An alert can prompt you to review a chart condition, but it is not a complete trading plan or financial advice. Review the broader trend, structure, momentum and other relevant conditions before drawing conclusions.
Why can trend and momentum show different readings?
Trend describes broader directional development, while momentum describes the strength or pace of recent movement. Momentum can weaken during a pullback or consolidation without proving that the larger trend has ended.
Are Fibonacci projections and volatility levels guaranteed targets?
No. They are reference levels that may help organise analysis or planning. Future price may not reach them, and they should not be treated as guaranteed outcomes.
Can an indicator replace independent trading judgment?
No. A TradingView indicator can organise chart information and support review, but it cannot replace independent analysis, risk consideration or an understanding of the tool’s limitations.


Recent Comments