
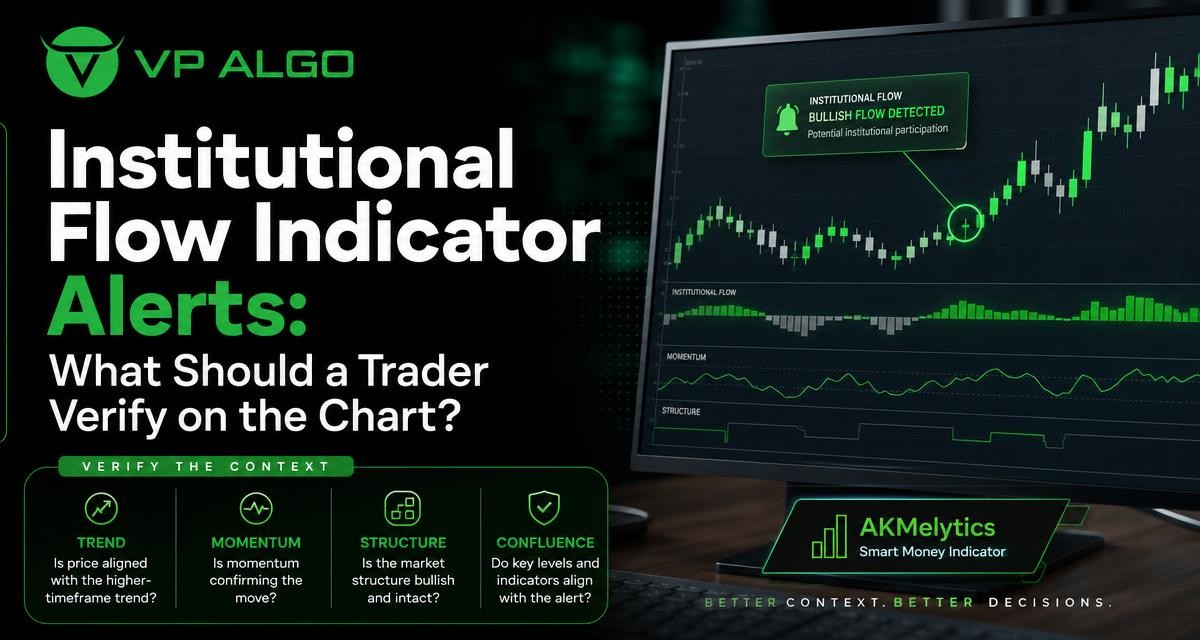
An institutional flow indicator alert can draw attention to a potentially meaningful change in market participation, but an alert is only the beginning of chart analysis. Before treating it as a possible setup, a trader should verify the broader trend, momentum, market structure, timeframe alignment and available risk references. This checklist explains how to examine those factors in a structured way using TradingView chart tools and indicator context.
What an institutional flow indicator alert can and cannot tell you
An institutional flow indicator is designed to help traders monitor participation-related conditions that may be difficult to evaluate from a single candlestick. Depending on the tool, an alert may relate to market flow, smart money conditions, trend changes, momentum or another defined event. The alert brings attention to the chart; it does not replace the work of interpreting price action.
Market participation is also not the same as a guaranteed direction. A flow-related reading can appear while price is pausing, retracing or moving through a volatile area. It may support a bullish or bearish interpretation, but that interpretation should be tested against the actual chart. The most useful question is not simply, “Did an alert appear?” It is, “What else is the market showing at the time of the alert?”
A practical verification sequence
Using the same sequence for each alert can make chart review more consistent. The order below moves from the wider context to the specific event, then to risk and invalidation. It is intended as an analytical framework rather than a fixed trading strategy.
- Identify the alert event. Determine what condition triggered the notification and when it occurred.
- Check the higher-timeframe trend. Establish whether the broader market is rising, falling or ranging.
- Review momentum. Look for evidence that price movement has strength or signs that momentum is weakening.
- Map market structure. Examine recent swing highs, swing lows, breaks of structure and changes of character.
- Check timeframe agreement. Compare the alert timeframe with higher- and lower-timeframe context.
- Mark relevant price areas. Note nearby structural levels, projected areas and potential invalidation points.
- Record the reasoning. Write down what confirms the alert and what could make the interpretation wrong.
Chart verification checklist
| Check | What to examine | Why it matters |
|---|---|---|
| Alert definition | The event, direction and candle on which the alert appeared | Prevents a notification from being interpreted without understanding its trigger |
| Trend | Higher-timeframe direction and the sequence of highs and lows | Shows whether the alert agrees with or opposes the broader market |
| Momentum | Strength, acceleration, slowing movement or conflicting signals | Helps distinguish continuation conditions from possible exhaustion |
| Market structure | Breaks of structure, changes of character and nearby swing points | Provides price-based context for the participation reading |
| Timeframe alignment | Whether multiple chart timeframes support the same interpretation | Reduces the chance of relying on an isolated short-term event |
| Risk reference | Volatility, invalidation area and possible target references | Frames the analysis before any decision is considered |
1. Confirm exactly what triggered the alert
Start by locating the candle and price level associated with the TradingView indicator alert. Read the alert condition in the indicator settings or documentation rather than assuming that every notification represents an entry signal. Some alerts may identify participation, momentum, a structure event or a combination of conditions.
Also check whether the alert appeared on a completed candle or during an unfinished candle. A developing candle can change before it closes, particularly in a fast market. For that reason, the candle state and the alert configuration are part of the verification process. A trader should know whether the alert is intended to notify an event as it develops, after confirmation, or under another condition defined by the indicator.
2. Check the higher-timeframe trend
A flow alert has different meaning in an established trend than it does inside a broad range. Begin with a higher timeframe and ask whether price is generally making higher highs and higher lows, lower highs and lower lows, or alternating around a relatively contained area. This simple classification helps place the alert in context.
A bullish participation reading within a rising structure may support a continuation interpretation, while the same reading against a persistent downtrend may represent a countertrend situation. Neither interpretation should be accepted automatically. The purpose of the trend check is to make the conflict or alignment visible before a trader gives the alert too much weight.
Questions for the trend review
- Is the broader structure directional or range-bound?
- Are recent swing points supporting the current direction?
- Is the alert close to a major opposing swing or an area where price has repeatedly reacted?
- Does the alert agree with the selected higher-timeframe trend assessment?
3. Use momentum as a supporting test
Momentum helps answer whether the market is moving with strength or whether a move may be losing energy. A momentum indicator for TradingView can be useful for this review, but it should be treated as supporting evidence. The key is to compare momentum with price behaviour rather than reading a value in isolation.
For example, an alert accompanied by expanding movement in the same direction may deserve a different review from an alert that appears while price is compressing or while momentum is diverging from price. A market can continue after weak momentum, and strong momentum can eventually become extended. Momentum therefore adds context; it does not provide certainty about the next move.
Momentum observations to record
- Whether momentum agrees with the direction suggested by the alert.
- Whether movement is strengthening, fading or fluctuating.
- Whether price and momentum are showing a noticeable divergence.
- Whether volatility makes the reading difficult to interpret cleanly.
4. Map market structure around the alert
Market structure translates the alert into visible price information. Mark the most relevant swing highs and lows, then examine whether price has broken a prior level or changed its behaviour near that level. A break of structure can show that the market has moved beyond a previous reference point. A change of character may suggest that the prior behaviour is weakening or shifting.
Structure events need location and scale. A small break on a lower timeframe may be less significant when the higher timeframe remains inside a larger range. Likewise, a structure event that occurs near a major swing point may deserve closer examination than one in the middle of congested price action. An indicator that includes BOS and CHoCH references can help organize this review, but the trader still needs to consider which timeframe and price area are relevant.
5. Compare multiple timeframes without forcing agreement
Multi-timeframe analysis is useful because different chart views answer different questions. A higher timeframe can provide directional context, a middle timeframe can show the current structure, and a lower timeframe can display the detail of a developing move. The exact timeframes depend on the trader’s method and are not universal.
The goal is not to make every timeframe display the same signal. Instead, identify whether the alert is a broad-context event or a short-term event against the broader direction. A lower-timeframe bullish alert inside a higher-timeframe bearish structure may be a temporary reaction, while a similar alert that follows a higher-timeframe structure shift may deserve a different type of review.
| Timeframe role | Review question |
|---|---|
| Higher timeframe | What is the dominant structure or broader market condition? |
| Analysis timeframe | What event or setup is the alert highlighting? |
| Lower timeframe | Is there clearer confirmation, hesitation or opposing price action? |
6. Examine flow in relation to price location
Participation-related information is more useful when connected to where price is trading. Ask whether the alert appeared near a prior swing, a structure boundary, a consolidation area or another level already visible on the chart. An alert in the middle of an undefined range may require more caution than one occurring after price tests a clearly marked area.
Price location also helps prevent a common mistake: treating the direction of an alert as more important than the surrounding conditions. A bullish reading near a nearby resistance area and a bullish reading after a sustained structural advance may both be bullish in isolation, but their chart contexts are different. The verification process should make those differences explicit.
7. Review volatility and risk references
Before considering any potential setup, identify what would invalidate the analysis. This may be a return through a structure level, a failure to hold a price area or another condition defined by the trader’s method. Without an invalidation reference, an alert can encourage a directional opinion without a clear way to reassess it.
Some smart money indicators include volatility-based target and risk reference levels, as well as Fibonacci projections or dashboard context. These features can help organize chart analysis, but they should not be treated as guarantees or as substitutes for personal risk decisions. A reference level is an analytical aid. The trader remains responsible for deciding whether the market context is clear enough to continue reviewing.
A simple pre-decision record
- Alert: What happened and on which candle?
- Trend: What is the higher-timeframe direction or condition?
- Momentum: Is movement confirming, weakening or conflicting?
- Structure: Which swing or structure event is relevant?
- Location: Is price near a meaningful area or in open range conditions?
- Invalidation: What observation would weaken the current interpretation?
Common mistakes when using indicator alerts
Treating an alert as an automatic trade instruction
An alert is a notification generated by defined conditions. It is not automatically a complete trading plan. Skipping trend, structure and risk review can lead to decisions based on one event rather than the full chart.
Ignoring the higher timeframe
Short-term signals can look persuasive when viewed alone. A higher-timeframe review may reveal that the signal is occurring inside a larger consolidation or against a dominant directional structure.
Using too many confirmations
Adding more indicators does not necessarily produce better analysis. Too many overlapping signals can make a chart difficult to interpret and can encourage selective reading. Choose a small set of checks that answer distinct questions: direction, momentum, structure and risk.
Failing to document conflicting evidence
A good checklist should record disagreement as well as confirmation. If momentum weakens while structure remains bullish, or if a flow alert appears directly below a significant opposing level, that conflict is part of the analysis rather than something to dismiss.
How an indicator can support a repeatable workflow
AKMelytics – Smart Money Indicator is a TradingView technical analysis tool that brings together areas such as trend analysis, momentum, market structure, market flow, relative strength and smart money concepts. Its multi-timeframe analysis, BOS and CHoCH events, Fibonacci projections, volatility-based references, dashboard context and configurable TradingView indicator alerts can help traders organize the review described above.
The benefit of a structured tool is not that it removes uncertainty. It can make relevant chart information easier to inspect in one workflow, while the trader still evaluates the alert against price action and personal rules. VP ALGO TRADING positions its indicators as tools for educational and trading-decision assistance, not as financial advice or a guarantee of results.
Final checklist before acting on an alert
Before moving from observation to a trading decision, pause and answer each question in plain language:
- Do I understand what condition generated the institutional flow indicator alert?
- Is the alert aligned with the higher-timeframe trend, or is it countertrend?
- Does momentum support the interpretation, or is there a clear conflict?
- What recent market structure event gives the alert context?
- Where is price relative to important swing points or projected areas?
- Do the selected timeframes provide useful agreement or reveal a conflict?
- What would invalidate the current interpretation?
If several answers are unclear, the chart may not yet provide enough context for a confident interpretation. Waiting for clearer information is also a valid outcome of a verification process. No indicator can remove market uncertainty, so the purpose of an institutional flow indicator is to support disciplined observation rather than replace judgment.
Frequently asked questions
What is an institutional flow indicator?
An institutional flow indicator is a charting tool that helps traders review participation-related conditions alongside information such as trend, momentum, market structure and smart money concepts. Its readings require context and do not guarantee a market direction.
Should an institutional flow indicator alert be treated as a buy or sell signal?
No. The alert should be treated as a prompt to review the chart. Trend, momentum, structure, timeframe alignment, price location and invalidation conditions should be examined before any trading decision.
Why does market structure matter when verifying an alert?
Market structure shows how price is behaving through swing highs, swing lows, breaks of structure and changes of character. It helps determine whether the alert agrees with a developing move or conflicts with the broader price pattern.
How do TradingView indicator alerts fit into a verification workflow?
TradingView indicator alerts can notify a trader when defined conditions occur. The notification saves time during market monitoring, but the trader still needs to open the chart and evaluate the event in its wider context.
Should all timeframes confirm an alert?
Not necessarily. Different timeframes serve different analytical purposes. The important point is to understand whether the alert is a short-term event within a larger trend, a possible structural shift or an event occurring inside a range.
Can an indicator eliminate trading losses?
No. An indicator can support analysis, but it cannot eliminate uncertainty or guarantee profitable results. Risk references and invalidation levels should be considered as part of a trader’s own process.
What is the best way to review a flow alert?
Use a consistent checklist: identify the alert condition, check the higher-timeframe trend, review momentum, map structure, compare timeframes, assess price location and define what would invalidate the interpretation.


Recent Comments