
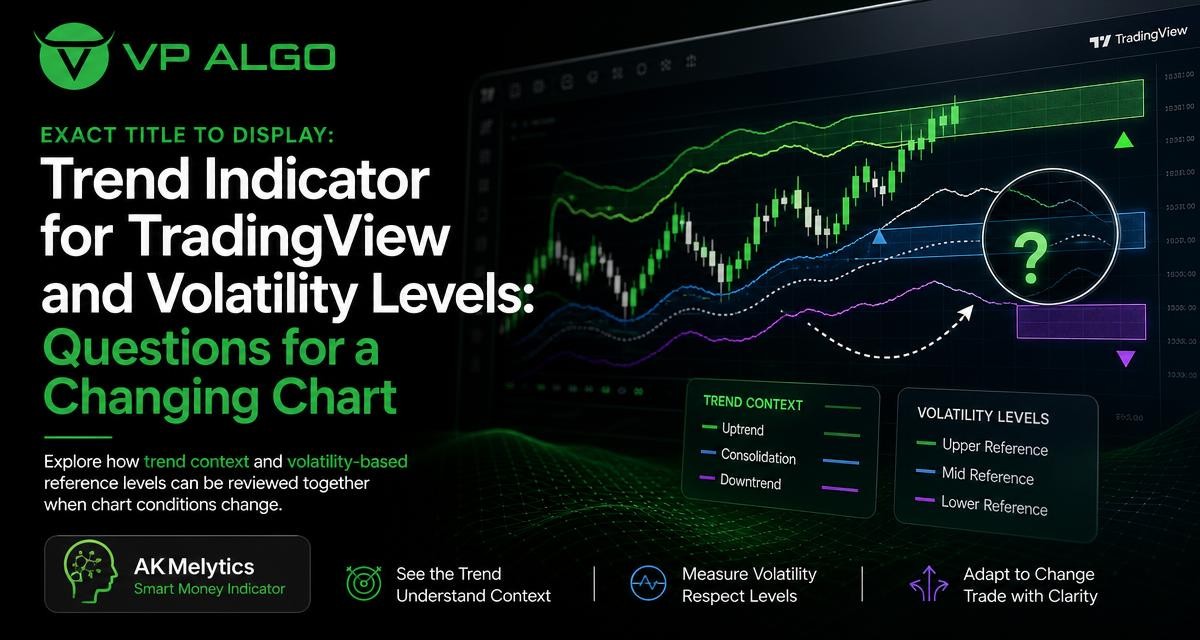
A trend indicator for TradingView can help organize a chart, but trend direction is only one part of a changing market. Momentum may weaken while price still appears bullish, market structure may shift before a larger move develops, and volatility can alter the distance between practical reference levels. Reviewing these elements together creates a more careful process for chart analysis without treating any indicator as a guarantee of what happens next.
Why trend context changes the way a chart should be read
A trend is not simply a label that remains fixed until a chart produces an opposite signal. Price can move upward while losing momentum, pause inside a broader trend, or create a short-term reversal that does not change the higher-timeframe direction. These transitions are why traders often need more context than a single line, color, or directional marker can provide.
For beginners, the main challenge is separating the current direction from the quality of that direction. A rising market may contain weak follow-through, repeated rejections, or a developing structural break. A falling market may show a temporary recovery rather than a confirmed reversal. A structured review asks what price is doing, how strongly it is moving, and whether the behavior agrees across the selected timeframes.
Trend direction is a starting point, not a complete decision
A trend tool can make directional context easier to see. It may help identify whether recent price action is leaning upward, downward, or sideways according to its calculations. That information is useful for narrowing attention, but it should be considered alongside market structure, momentum, and the location of price within the current range.
This distinction matters because a trend indicator describes a calculated condition; it does not remove uncertainty. Traders still need to define what would support a potential setup, what would challenge the idea, and which conditions would make the chart too unclear to interpret.
What volatility levels add to trend analysis
Volatility describes how much price is moving over a given period. When volatility expands, price may cover larger distances and move rapidly through nearby levels. When volatility contracts, the same chart may produce smaller movements, pauses, and false starts. A trend reading viewed without this context can lead to unrealistic expectations about how far price might travel or how quickly a setup may develop.
Volatility-based reference levels can provide a framework for reviewing possible target and risk areas. They are not predictions and should not be treated as fixed outcomes. Instead, they help place a directional idea within the current behavior of the chart. A potential continuation in a high-volatility environment may require a different interpretation from a similar signal during a quiet consolidation.
| Chart condition | What a trader may review | Question to ask |
|---|---|---|
| Established directional movement | Trend alignment, momentum and structure | Is the move continuing with sufficient confirmation? |
| Increasing volatility | Range expansion and volatility-based reference levels | Are nearby levels still realistic for the current movement? |
| Contracting volatility | Consolidation, support and resistance, and breakout context | Is the chart developing a direction or simply compressing? |
| Possible structural transition | BOS, CHoCH and higher- or lower-timeframe context | Is this a meaningful change or a short-term price reaction? |
Questions to ask when trend and volatility disagree
The most useful chart reviews often begin with questions rather than immediate conclusions. If the trend appears bullish but volatility is expanding sharply, the issue may not be whether the trend is technically up. The issue may be whether the current movement is orderly enough to support the same interpretation as earlier price action.
Is the trend still aligned across timeframes?
Multi-timeframe analysis can show whether a short-term move agrees with a broader market condition. For example, a lower timeframe may turn upward while a higher timeframe remains in a declining structure. That does not automatically make the lower-timeframe signal invalid, but it changes how the move should be understood. It may represent a countertrend reaction, a retracement, or the early stage of a larger transition.
Reviewing multiple timeframes can also prevent a trader from treating a local signal as the complete market picture. The purpose is not to force every timeframe to agree. It is to make the relationship between them visible before a potential setup is evaluated.
Has momentum confirmed the direction?
Trend and momentum answer related but different questions. Trend analysis focuses on directional context, while momentum helps examine the strength and persistence of recent movement. A chart can remain in an upward trend while momentum fades. Conversely, momentum can improve during a recovery before the broader structure has changed.
When these readings disagree, the disagreement is information. It may suggest that price is approaching a pause, retracement, or transition. It does not provide a guaranteed reversal signal, but it can encourage a more patient review of confirmation and risk reference levels.
What does market structure show?
Market structure focuses on the sequence and behavior of important highs and lows. Break of Structure, often shortened to BOS, may be used to describe a break that supports continuation or a developing directional change. Change of Character, or CHoCH, is commonly used to describe a possible shift in the prior behavior of price. These terms are analytical references, not assurances of future movement.
Structure should be interpreted in context. A small break on a low timeframe may have limited significance if the higher-timeframe trend remains intact. Similarly, a structural event accompanied by stronger momentum and expanding participation may deserve closer attention than an isolated price movement.
How a TradingView indicator can organize the review
A TradingView indicator can bring several observations into one visual workspace. The AKMelytics – Smart Money Indicator is designed to combine trend analysis, momentum evaluation, market structure, market flow, relative strength and smart money concepts. It also includes multi-timeframe analysis, BOS and CHoCH structure events, Fibonacci projections, volatility-based target and risk reference levels, dashboard context and configurable TradingView alerts.
The value of bringing these features together is organizational. Instead of switching between unrelated tools for every question, a trader can review several dimensions of the same chart and compare their relationship. That does not make the analysis automatic. It can, however, make the reasoning process more consistent and easier to explain.
Using the dashboard as context rather than a verdict
A dashboard can summarize conditions that would otherwise require several visual checks. It may help a trader see whether trend, momentum, structure and other readings are pointing in a similar direction or showing tension. The summary should be treated as a prompt for investigation, not as a substitute for understanding the price chart.
When the dashboard and chart appear to disagree, the disagreement deserves attention. A summary may reflect a calculated condition from one timeframe while the visible price action is responding to a shorter-term event. Checking the timeframe, recent structure and current volatility can help explain the difference.
Using alerts without confusing notification with confirmation
Configurable alerts can help traders monitor selected conditions on TradingView. An alert tells the user that a defined condition has occurred; it does not independently establish that a trade is suitable or that the broader market context supports action. Traders still need to review the chart, the relevant timeframe and their own risk process.
Alerts are most useful when they reduce the need to watch every candle continuously while preserving a deliberate review step. They should support attention and consistency, not encourage automatic reactions to every notification.
Volatility-based target and risk reference levels
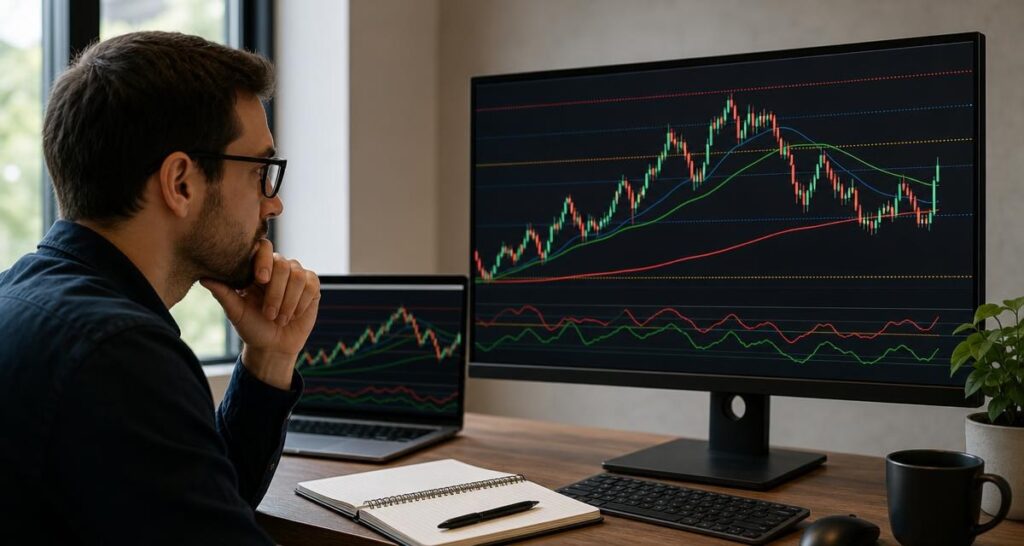
Volatility-based levels can help frame a chart in terms of distance. A reference level may provide a way to consider where price could encounter a reaction, how far a movement has already traveled, or whether a proposed setup requires an unusually large move. The level is a planning aid rather than a promised target or a guaranteed protective boundary.
Interpretation should account for the current structure. A volatility level placed beyond a recent swing may have a different meaning from one located inside a congested range. Likewise, a reference distance that appears reasonable during quiet conditions may need closer scrutiny after a sudden expansion in price movement.
- Compare the reference level with recent swing highs and lows.
- Check whether the level sits inside a consolidation area or beyond a meaningful structural point.
- Consider whether current volatility is expanding, contracting or returning to a prior range.
- Review higher-timeframe context before treating a lower-timeframe level as significant.
- Define invalidation conditions separately from a hoped-for price objective.
This process helps keep volatility levels in their proper role. They can structure questions about distance and market behavior, but they cannot eliminate execution risk, unexpected price movement or the possibility that the original analysis is wrong.
A practical workflow for changing chart conditions
A repeatable workflow can make stock trend analysis less dependent on a single visual impression. The following sequence is designed for review and education, not as a fixed trading strategy or personalized financial guidance.
- Begin with the broader context. Identify the selected higher-timeframe direction, range or transition before focusing on a short-term signal.
- Review the current structure. Note relevant highs, lows, BOS or CHoCH events, and whether the latest movement supports or challenges the prior structure.
- Check momentum and relative strength. Look for confirmation, weakening movement or a disagreement that may justify waiting for more information.
- Assess volatility. Determine whether price is moving in a compressed range or expanding rapidly, then review the distance to volatility-based reference levels.
- Compare timeframes. Establish whether the lower-timeframe condition is aligned with, neutral to, or opposed to the broader context.
- Write down invalidation conditions. A clear analysis includes what would make the current interpretation less credible.
- Review alerts and signals selectively. Treat notifications as prompts to inspect the chart rather than instructions to act.
The workflow is deliberately cautious. It allows the chart to provide several forms of evidence before a trader decides whether a potential setup deserves further consideration. It also creates a record of why the chart was interpreted a certain way, which can be useful when reviewing decisions later.
Common mistakes when reading trend and volatility together
Treating every trend change as a reversal
A short-term change in direction does not necessarily reverse the broader market. Without timeframe context, a trader may confuse a retracement with a new trend. Reviewing structure at more than one scale can reduce this risk of interpretation.
Using volatility levels as exact forecasts
Volatility-based reference levels are calculated guides, not promises about where price will stop or turn. Price can move through them, stall before reaching them, or change direction for unrelated reasons. Their purpose is to support planning and comparison, not certainty.
Adding more signals instead of resolving contradictions
When trend, momentum and structure disagree, adding another indicator may create more noise. A better approach is to ask why the readings differ. The cause may be a timeframe mismatch, a market transition, low conviction or a rapidly changing volatility environment.
Ignoring the difference between analysis and advice
Technical tools can assist with chart evaluation, but they do not know a trader’s circumstances, objectives or tolerance for loss. The AKMelytics – Smart Money Indicator is intended to support analysis and trading decisions, not to provide financial advice or guarantee results. Any use of the tool should be accompanied by independent judgment and appropriate risk awareness.
What to look for in a trend indicator for TradingView
When evaluating a TradingView trading indicator, consider whether it helps answer the questions you actually ask during chart review. Useful capabilities may include trend context, momentum information, market structure events, multi-timeframe visibility, volatility references and configurable alerts. The important point is not the number of features, but whether the information can be interpreted clearly and used consistently.
| Capability | Purpose in chart review | Limitation to remember |
|---|---|---|
| Trend analysis | Shows calculated directional context | Does not guarantee continuation |
| Momentum evaluation | Helps assess movement strength | Momentum can change quickly |
| Market structure | Highlights possible continuation or transition events | Significance depends on timeframe and context |
| Volatility references | Frames potential distance and risk questions | Levels are not certain targets or outcomes |
| Alerts | Notifies users when selected conditions occur | Notification is not confirmation or advice |
VP ALGO TRADING develops and sells indicators and algorithmic trading tools for TradingView. Its indicator offering is positioned as educational and decision-support software rather than financial advice. Traders who need help with installation, activation or usage can contact the company through its available support process. Product access instructions include providing a TradingView ID by email after purchase, while the website also offers a request-based seven-day free trial for the indicator and Telegram channel. Eligibility and current terms should be confirmed directly with the company.
Final perspective: let changing conditions change the questions
A trend indicator for TradingView is most useful when it encourages better questions rather than replacing judgment. Is the direction aligned across timeframes? Is momentum confirming or fading? Has market structure changed meaningfully? Is volatility expanding enough to alter the interpretation of target and risk reference levels?
Answering those questions together can produce a more disciplined chart review. The objective is not to find a tool that removes uncertainty. It is to use trend, momentum, structure, smart money context and volatility information as separate pieces of evidence, then recognize when the chart is clear, conflicted or changing. That approach keeps the indicator in its proper role: a support for analysis, not a promise of results.
Frequently asked questions
What is a trend indicator for TradingView?
It is a TradingView tool that calculates and displays information intended to help users assess directional market conditions. It should be combined with price action, timeframe context, structure and risk awareness rather than treated as a guaranteed signal.
Why review volatility with trend direction?
Volatility shows how actively price is moving. Reviewing it with trend direction can help traders judge whether a movement is orderly, compressed or expanding and whether reference distances remain relevant to current chart conditions.
What are volatility-based target and risk reference levels?
They are calculated chart references that help frame possible price distance and planning questions. They are not guaranteed targets, fixed outcomes or assurances that price will respect a particular level.
How can multi-timeframe analysis improve chart review?
It shows whether a short-term condition agrees with or conflicts with broader market context. This can help distinguish a possible continuation, retracement or transition, although it cannot predict future price movement with certainty.
What do BOS and CHoCH mean?
BOS generally refers to Break of Structure, while CHoCH commonly refers to Change of Character. They describe ways traders discuss structural continuation or a possible shift in price behavior. Their importance depends on timeframe and surrounding evidence.
Does the AKMelytics – Smart Money Indicator provide financial advice?
No. It is designed to support technical analysis and trading decision-making. It is not a financial adviser and does not guarantee profits, eliminate losses or provide personalized financial guidance.
Can TradingView alerts replace chart analysis?
No. Alerts notify users that a selected condition has occurred. The chart, timeframe, volatility, structure and personal risk process still need to be reviewed before any decision is considered.


Recent Comments