
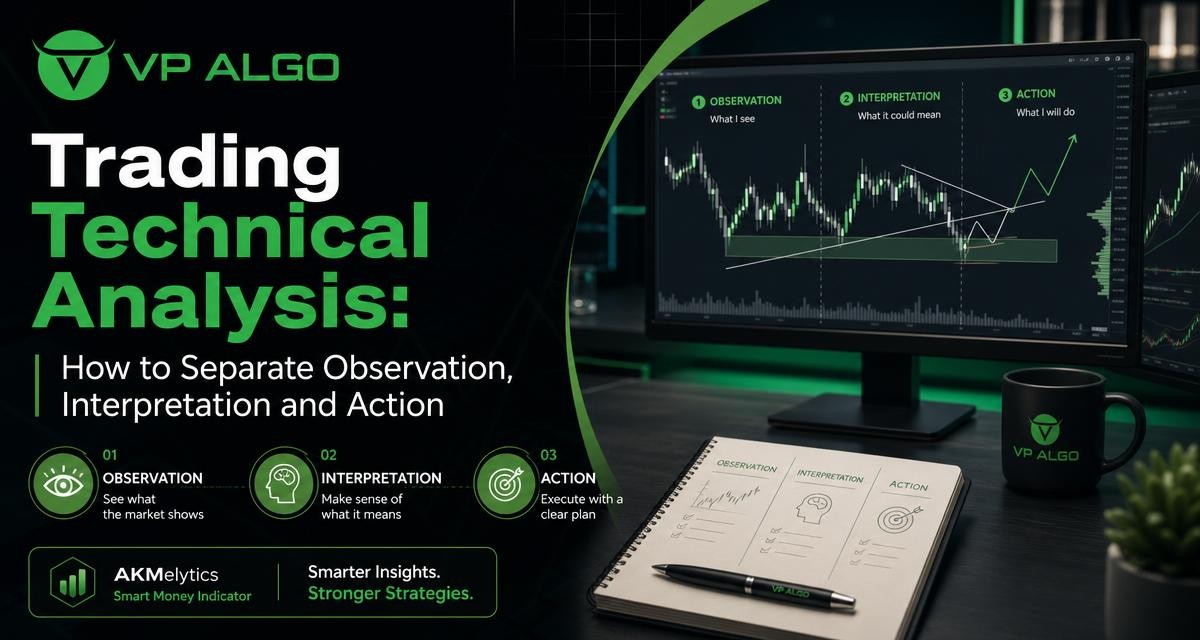
Trading technical analysis becomes more useful when traders separate three different activities: observing what the chart shows, interpreting what those observations may mean, and deciding what action fits the plan. Mixing these stages can turn a neutral chart detail into an emotional trade idea within seconds. A three-stage framework creates more space for evidence, uncertainty and risk control.
Why separating the three stages matters
A chart contains information, but it does not automatically provide a complete explanation or a trading instruction. A series of higher highs and higher lows is an observation. Calling that structure bullish is an interpretation. Entering a long position at a particular level is an action. Each step adds a layer of judgment.
When these layers are blended together, traders may treat an assumption as if it were a fact. For example, a strong candle may be described as proof that buyers will continue to dominate. That conclusion goes beyond what the candle itself shows. The move may be significant, but its meaning depends on location, market structure, momentum, timeframe and the trader’s predefined conditions.
- Observation: Record visible or measurable chart information without adding a prediction.
- Interpretation: Develop one or more possible explanations for that information.
- Action: Decide whether the setup meets the rules for entry, waiting, reducing exposure or doing nothing.
This approach does not remove uncertainty from trading. Instead, it makes uncertainty easier to recognise and manage. It also helps traders review their decisions later because they can identify whether a problem came from reading the chart, interpreting the context or breaking an action rule.
Stage one: make a neutral observation
The first stage of trading technical analysis is descriptive. The aim is to write down what is present on the chart before assigning a label such as bullish, bearish, strong or weak. A useful observation can be checked by another person looking at the same chart, even if that person reaches a different conclusion about what may happen next.
Examples of chart observations
- Price is above or below a selected moving average, if that tool is part of the method.
- The latest swing high is above, below or near a previous swing high.
- A market structure event, such as a break of structure or change of character, is visible according to the chosen definitions.
- Momentum has increased, decreased or remained mixed over the selected lookback period.
- Price has returned to a previously identified area of interest.
- Several timeframes show aligned structure, while another timeframe shows a conflicting move.
- A candle closed beyond a reference level, or moved beyond the level but closed back inside it.
Notice the difference between “price closed above the prior swing high” and “buyers have taken control.” The first statement describes an event. The second explains the event and implies a conclusion. That conclusion might be reasonable, but it belongs in the interpretation stage.
Use precise language
Vague words often hide untested assumptions. Instead of writing that the market looks strong, record the specific details that led to that impression. You might note that price is making higher swing points, the latest pullback held above a prior low and momentum readings increased. This creates a more useful record than a single broad label.
Observations should also include the timeframe and reference points used. A market can be making higher highs on a short-term chart while remaining inside a broader range on a higher timeframe. Without that context, a technically accurate observation can still be incomplete.
Stage two: interpret the evidence without overstating it
Interpretation connects chart information to a possible market condition. It is not a fact, and it is not a guarantee. The same observation can support different interpretations depending on the surrounding context, the timeframe and the rules of a particular trading strategy.
Ask what the evidence could mean
If price closes above a previous swing high, one interpretation is that the existing range may be changing. Another is that the move could be a temporary break followed by a return into the range. If momentum rises at the same time, that may add context, but it does not settle the question by itself.
A disciplined interpretation therefore uses conditional language. Phrases such as “this may indicate,” “one possible explanation is” and “the idea would be weakened if” are useful because they keep the analysis open to new information. This is especially important when working with concepts such as smart money activity or institutional flow, where a chart may offer clues but cannot reveal every participant’s intentions.
Build a small number of scenarios
Rather than forcing a single forecast, create a primary scenario and at least one alternative. For example:
- Continuation scenario: If price holds a defined support area and structure remains intact, the current move may continue.
- Failure scenario: If price breaks that area and closes below it, the continuation idea may be weakened or invalidated.
- Unclear scenario: If price remains between key levels with conflicting momentum, waiting may be more appropriate than selecting a direction.
The purpose is not to predict every possible outcome. It is to identify what would support or challenge the current interpretation. This turns a chart view into a testable idea instead of a story that can be adjusted after every new candle.
Stage three: connect the interpretation to an action rule
Action is the point at which analysis affects behaviour. It can mean entering a trade, waiting for confirmation, setting an alert, reducing exposure or deciding not to participate. A sound interpretation does not automatically require a trade. The setup still needs to meet the conditions defined by the trader’s plan.
Define the decision before the signal appears
A written plan can specify the market conditions that must be present, the trigger that would be used, the level that would challenge the idea and the circumstances that make the setup unsuitable. It can also define when no action is allowed, such as when higher-timeframe and lower-timeframe evidence conflicts or when the market is moving inside an unclear range.
This separation helps prevent a common mistake: changing the action rule to preserve an interpretation. If a trader decides that a setup requires a close beyond a level, an intrabar move beyond that level should not quietly become sufficient simply because the chart feels urgent.
A practical decision table
| Stage | Core question | Example output | What to avoid |
|---|---|---|---|
| Observation | What can be identified directly? | Price closed above the prior swing high on the selected timeframe. | Calling the move guaranteed continuation. |
| Interpretation | What might the evidence indicate? | The range may be transitioning, but a failed break remains possible. | Treating one explanation as certain. |
| Action | What does the plan allow? | Wait for the defined retest or remain flat if the trigger is absent. | Entering because the chart feels persuasive. |
The table is deliberately simple. Its value comes from using it consistently. A sophisticated charting platform cannot replace a clear decision process, and a simple chart can still support careful analysis when the stages are kept distinct.

How different technical inputs fit into the framework
Many traders use several forms of evidence at once. Trend analysis, momentum, market structure, relative strength, volatility references and smart money concepts can all contribute to a review. The three-stage framework does not require choosing only one tool. It requires stating what each tool actually contributes.
Trend analysis
Trend tools may help describe the direction or organisation of price movement. An observation might be that price remains above a selected trend reference. The interpretation could be that the broader directional bias is still constructive. The action rule might require a pullback and a separate trigger rather than an immediate entry.
Momentum analysis
Momentum can add information about the pace or persistence of movement. Rising momentum may support a continuation interpretation, while weakening momentum may encourage closer review of a move that is still advancing. It should not be treated as a standalone command to buy or sell. Momentum and price structure can also disagree, creating a reason to wait or reduce confidence.
Market structure and smart money concepts
Market structure analysis often focuses on swing points, breaks of structure and changes in character. Smart money concepts may be used to examine areas of interest, liquidity-related behaviour or possible shifts in participation. These ideas can organise a chart review, but their labels must be defined consistently. If the same event is called a break of structure in one situation and ignored in another, the interpretation becomes difficult to test.
A TradingView tool such as the AKMelytics – Smart Money Indicator can help bring several chart inputs into one analytical view. Its described features include momentum, trend analysis, market structure, market flow, relative strength, smart money concepts, multi-timeframe analysis, Fibonacci projections, volatility-based target and risk reference levels, dashboard context and configurable alerts. These features can support observation and review; they do not remove the need for the trader to interpret context and apply an independent decision process.
Use multi-timeframe analysis without mixing signals
Multiple timeframes can provide context, but they can also create confusion if each chart is treated as a separate instruction. A practical approach is to assign each timeframe a role. For example, a higher timeframe may describe the broader structure, an intermediate timeframe may help identify the area of interest, and a lower timeframe may be used for a defined trigger. The exact timeframes depend on the trader’s method and are not universal rules.
Record observations separately for each timeframe before combining them. If the higher timeframe is ranging, the intermediate timeframe is rising and the lower timeframe is falling, that is not necessarily a contradiction. It may simply describe a short-term move within a larger range. The interpretation should acknowledge the relationship rather than selecting the most convenient chart.
Turn the framework into a repeatable journal process
A trading journal does not need to be complicated. It should make the reasoning visible before and after the decision. The following structure can be used for discretionary analysis, systematic review or a combination of both.
- Record the context: Note the instrument, timeframe, relevant reference levels and the tools used.
- Write observations: Describe structure, trend, momentum and other visible conditions without predictions.
- List interpretations: State the primary explanation, an alternative and the evidence that would weaken each one.
- Define the action: Write the precise condition for entry, waiting, alert placement or no trade.
- Review execution: Compare what happened with the written plan, not only with the eventual market movement.
Reviewing execution rather than outcome is important. A trade can follow the plan and still move differently from the interpretation. Conversely, a profitable result can come from an undisciplined decision. Separating process quality from outcome helps keep the journal useful over time.
Common mistakes that blur observation, interpretation and action
Starting with a trade idea
When a trader begins with “I want to buy,” chart evidence may be selected to support that conclusion. Begin with a neutral description instead. The direction of the eventual action should follow the rules and evidence, not precede them.
Confusing a signal with confirmation
An indicator alert or structure event can be a prompt for review. It is not automatically confirmation of every condition required by a trading plan. Check the timeframe, surrounding structure, momentum and invalidation conditions before deciding what it means.
Adding reasons after the decision
Post-decision explanations can make a trade appear more coherent than it was at the time. Write the observation and interpretation before acting whenever possible. If the decision was made quickly, mark which information was actually available then.
Ignoring the no-action outcome
Waiting is an active decision when the evidence is incomplete. A framework that recognises only buy and sell outcomes encourages unnecessary participation. “No trade because the required condition is absent” is a complete and reviewable result.
How indicators can support, rather than replace, analysis
Trading indicators are most useful when they reduce repetitive chart work or make a chosen framework easier to inspect. A dashboard may gather context, an alert may draw attention to an event, and reference levels may help organise a scenario. The trader still needs to understand the definitions behind those outputs and decide whether they fit the current chart.
VP ALGO TRADING develops TradingView indicators and algorithmic trading tools for trading analysis. The AKMelytics – Smart Money Indicator is positioned as a tool for evaluating potential setups and supporting decision-making, not as financial advice or a promise of results. Users should test how an indicator fits their own process, understand its settings and avoid treating any output as a guaranteed outcome.
A concise checklist before taking action
- What exactly happened on the chart?
- Which timeframe and reference levels support that observation?
- What are the reasonable interpretations, including an alternative?
- What evidence would weaken or invalidate the preferred interpretation?
- Does the setup meet every condition in the trading plan?
- Is the appropriate action entry, waiting, an alert, reduced exposure or no trade?
- Can the decision be explained without relying on the eventual result?
Trading technical analysis is not only about finding more signals. It is also about improving the quality of the questions asked before a decision. By separating observation from interpretation and action, traders can make their reasoning clearer, identify uncertainty earlier and review their trading strategies more honestly. Tools such as the AKMelytics – Smart Money Indicator may help organise chart information, but disciplined judgment remains essential.
Frequently asked questions
What is the difference between observation and interpretation in trading technical analysis?
Observation describes information visible on the chart, such as a closing price above a prior swing high. Interpretation explains what that information may mean, such as a possible shift in market structure. Interpretation remains conditional rather than certain.
Does a technical indicator tell me when to enter a trade?
An indicator can highlight conditions or events for further review, but it does not replace a trading plan. The trader must decide whether the output fits the wider context, required trigger and risk rules.
Why should I write alternative scenarios?
Alternative scenarios reduce attachment to a single forecast. They clarify what could challenge the preferred interpretation and make it easier to define when waiting or no action is appropriate.
How does multi-timeframe analysis fit this framework?
Each timeframe can have a separate role, such as broader context, area identification or trigger review. Record observations on each timeframe before combining them so that short-term movement is not confused with the broader structure.
Can smart money concepts be used as objective signals?
They can provide a structured way to examine market structure, flow and areas of interest, but the terms must be defined and applied consistently. They should be treated as analytical context, not as proof of future price movement.
What should I do when the chart evidence conflicts?
Return to the action rules in your plan. Conflicting evidence may justify waiting, setting an alert or taking no trade until a defined condition resolves the uncertainty.
Is a no-trade decision part of a trading strategy?
Yes. A strategy can specify when conditions are insufficient or contradictory. Treating no action as a valid outcome helps prevent trades that are driven by urgency rather than evidence.


Recent Comments