
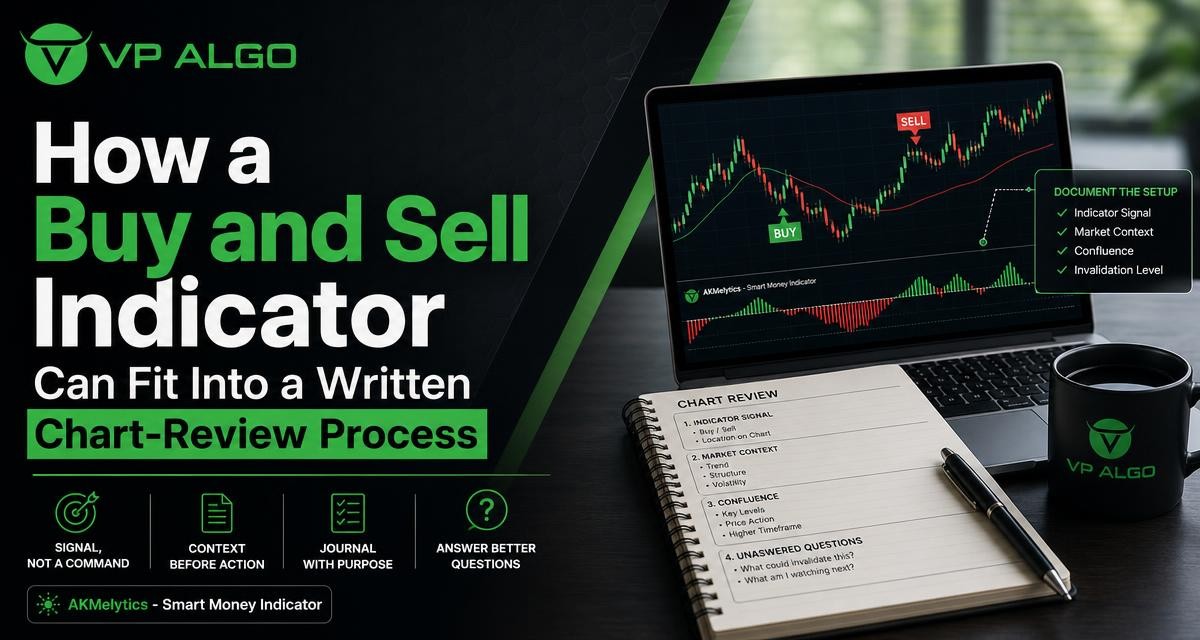
A buy and sell indicator can help organize what you see on a chart, but its output is more useful when it becomes one part of a written review rather than an instruction to act immediately. A practical process records the indication, the surrounding trend, momentum, market structure, institutional-flow context and the questions that remain unanswered. This approach gives traders a repeatable way to examine a potential setup without treating any trading indicator as a guarantee of an outcome.
Why a written review matters when using an indicator
Many traders first encounter an indicator through a visual event: a buy or sell label, a change in color, an alert or a movement on a dashboard. The speed of that signal can be useful for drawing attention to a chart. However, a single output rarely explains the complete market situation. It may not tell you whether price is moving with a broader trend, whether momentum supports the move, or whether the market is approaching a level where the original idea could become less relevant.
Writing down the reasoning creates a pause between observation and decision. That pause is not designed to make a trader predict the market with certainty. It is designed to separate what the chart shows from what the trader assumes. Over time, completed reviews can also show whether a process is being followed consistently and which questions are repeatedly being overlooked.
Signal, evidence and decision are different things
A useful review distinguishes three separate elements. The signal is the event produced by the indicator. The evidence is the surrounding chart information that may support or weaken the event. The decision is the trader’s considered response after reviewing both the signal and the evidence.
- Signal: What did the indicator display, and when did it appear?
- Evidence: What do trend, momentum, structure and flow-related features show?
- Decision: What is the next planned action, including the choice to wait or take no action?
This distinction helps prevent a label from becoming a command. A buy indication can be recorded as a reason to investigate a chart. A sell indication can be recorded as a reason to reassess the current view. Neither needs to be treated as a promise that price will move in a particular direction.
What to record when a buy or sell indication appears
A chart-review note should be detailed enough to recreate the reasoning later, without becoming so long that the process is difficult to repeat. Start with objective information about the chart and the indicator event. Then add interpretation separately. This makes it easier to identify which conclusions came directly from the chart and which were assumptions made by the trader.
| Review area | Questions to record | Why it matters |
|---|---|---|
| Indicator event | What indication appeared, on which timeframe and at what chart location? | Defines the exact event being reviewed. |
| Trend | Is the broader directional context rising, falling or unclear? | Places the indication within a wider market view. |
| Momentum | Does momentum support the direction, weaken it or remain mixed? | Tests whether movement has supporting energy. |
| Market structure | Are there visible breaks, shifts or other structure events? | Shows whether the current price action is changing or continuing. |
| Market flow | Does the available flow-related context agree with the indication? | Adds another perspective without replacing judgment. |
| Uncertainty | What is not confirmed, and what could invalidate the current view? | Prevents confidence from exceeding the available evidence. |
| Next step | What must happen before further consideration, or why is waiting appropriate? | Turns the review into a defined process rather than an impulse. |
Begin with the market context
Before interpreting a buy and sell indication, describe the chart’s general condition. Is price moving in a clear direction, oscillating within a range or showing a transition between conditions? Avoid forcing a directional description when the chart is mixed. “Unclear” is a valid observation and can be more useful than assigning a trend simply because an indicator has produced a label.
Record the timeframe under review and, where relevant, the broader timeframe being used for context. A multi-timeframe view can help a trader compare a local indication with a wider trend assessment, but the timeframes should be named clearly. A short-term indication and a broader market view may not agree, and that disagreement belongs in the written note.
Using trend and momentum as supporting context
Trend analysis asks how price has been behaving over the selected period. Momentum analysis asks whether the current movement appears to have support, is losing strength or is difficult to classify. These are related but different questions. A chart may have a directional trend while momentum is fading, or it may show improving momentum before a clear trend has developed.
When reviewing the Best trading indicator buy and sell question, do not use trend or momentum as automatic confirmation. Instead, write a short comparison between the indication and the context. For example, a note might state that a buy indication appeared while the broader trend was upward but momentum was mixed. That statement is more informative than simply writing “buy confirmed,” because it preserves the unresolved part of the analysis.
A simple context description
- Describe the broader trend as rising, falling, sideways or uncertain.
- Describe recent momentum as strengthening, weakening or mixed.
- State whether the indication agrees with both observations, one observation or neither.
- Record what new evidence would change the current interpretation.
This structure keeps the indicator in its proper role. It can help surface information and organize analysis, while the written review explains how the information fits together.
Reviewing market structure instead of relying on labels alone
Market structure provides a way to study how price is forming and changing over time. The AKMelytics – Smart Money Indicator includes features related to market structure, including BOS and CHoCH events. In a review, these events should be documented as chart observations and interpreted in relation to the rest of the setup.
A structure event may be relevant because it appears to support continuation, suggest a possible change in direction or highlight a conflict with the current indication. The review should explain which interpretation is being considered and what remains unconfirmed. A break or change event is not, by itself, a complete trading plan. It is one piece of information that needs to be viewed alongside trend, momentum, flow-related context and the trader’s own rules.
Questions for a structure review
- What structure event is visible, and where did it occur?
- Does it support continuation or suggest a possible shift?
- Is the event aligned with the buy or sell indication?
- Could the event be interpreted differently if the chart timeframe changes?
- What would make the current structure reading less convincing?
These questions encourage careful description rather than retrospective storytelling. They also make it easier to compare similar chart situations later.
Adding smart money and flow-related context carefully
Smart money concepts and institutional-flow features can add another layer to a chart review. The purpose of recording them is not to assume that every movement represents a known institution or to turn a flow-related display into certainty. Instead, note whether the available context appears aligned with, opposed to or unrelated to the indication.
For example, a review might record that a sell indication appeared while the broader trend was unclear and flow-related context did not provide a clear directional reading. That note supports patience without claiming that a decline must follow. Similarly, a buy indication that aligns with several chart observations can be described as a setup worthy of further review, not as a guaranteed result.
Using cautious language is part of good documentation. Words such as “suggests,” “is consistent with,” “remains unclear” and “requires confirmation” distinguish an observation from a prediction. This is especially important when reviewing tools that combine multiple inputs into a dashboard or summarized signal.
Turning the review into a repeatable workflow
A written process is most useful when it can be followed in the same general order. The exact rules will differ between traders, markets and timeframes, so the workflow should describe analysis rather than prescribe a particular trade. The following sequence can help organize a chart review around a trading indicator.
- Mark the event. Record the buy or sell indication, its time, the timeframe and the chart location.
- Describe the wider context. Note the broader trend and whether the current price is moving with or against it.
- Assess momentum. Record whether momentum supports the indication, weakens it or remains mixed.
- Inspect structure. Review relevant BOS, CHoCH or other visible structure events and describe their meaning cautiously.
- Check flow-related information. Note whether smart money or institutional-flow context adds agreement, conflict or no clear information.
- Identify unanswered questions. Write down what is not yet confirmed and what could invalidate the current view.
- Define the next review point. State what you will monitor next, or why no further action is appropriate at present.
- Save the note. Keep the chart context and written explanation together so the review can be examined later.
The final step is often overlooked. Without a saved note, it is easy to remember the signal but forget the uncertainty that surrounded it. A record allows the trader to review process quality without relying entirely on memory.

How to use alerts without turning them into commands
Configurable TradingView alerts can help draw attention to a chart event. In a written process, an alert should begin a review rather than end one. When an alert arrives, record the event and open the relevant chart context. Then complete the review questions before deciding what, if anything, the event means within your own approach.
This distinction is useful because an alert may arrive while market conditions have changed, while the trader lacks sufficient context or while another part of the analysis is in conflict. Treating the alert as a prompt protects the review process from becoming an automatic response to a notification.
What an alert note can include
- The alert type and time.
- The chart timeframe and instrument being reviewed.
- The current trend and momentum description.
- Any nearby structure event or relevant dashboard information.
- The reason for waiting, continuing the review or ending the review.
Questions that improve the quality of a chart review
The strongest review questions are specific enough to answer from the chart. Avoid vague prompts such as “Is this a good trade?” Replace them with questions that expose the evidence and the uncertainty behind the view.
| Less useful prompt | More useful prompt |
|---|---|
| Is this signal correct? | What evidence supports the indication, and what evidence conflicts with it? |
| Should I buy or sell? | What conditions would need to be present before this setup deserves further consideration? |
| Will price continue? | What market information would suggest continuation, and what would suggest a change? |
| Does the indicator work? | Am I applying the same review process consistently across comparable chart situations? |
| Is this the best trading indicator buy and sell option? | Does this tool provide the chart context and review features that fit my defined process? |
These questions shift attention away from finding a perfect signal and toward evaluating whether the tool supports disciplined observation. That is a more practical standard for comparing a trading indicator with the needs of a particular chart-review method.
Where the AKMelytics Smart Money Indicator can fit
VP ALGO TRADING offers the AKMelytics – Smart Money Indicator as a TradingView technical analysis tool. Its described features include momentum, trend analysis, market structure, market flow, relative strength, smart money concepts, multi-timeframe analysis, Fibonacci projections, volatility-based target and risk reference levels, dashboard context and configurable alerts.
Within a written review, those features can be treated as separate areas to inspect rather than as a single instruction. A trader might record the indication first, then compare it with trend and momentum, review structure events, examine the available flow-related context and document any reference levels or dashboard information that is relevant to the setup. The tool supports analysis and decision-making; it does not replace the trader’s own review or provide financial advice.
Before using any indicator, traders should understand what its displays mean, how they fit their own rules and which parts of the analysis remain subjective. Product support is available for installation, activation and usage assistance according to the supplied business information, but support does not turn an indicator into personalized financial guidance.
Common mistakes to avoid
Starting with the conclusion
Writing “buy” or “sell” at the top of a note can cause the rest of the review to become a search for confirmation. Begin with the observable event and the chart context instead. If a conclusion is recorded, place it after the evidence and unanswered questions.
Ignoring conflicting information
A mixed reading is still a reading. If trend, momentum and structure do not agree, record the conflict directly. Hiding disagreement produces a cleaner-looking note but a weaker process.
Changing the review after the outcome is known
Post-event analysis can be valuable, but the original note should remain intact. Add a separate follow-up describing what happened and whether the initial reasoning was clear. This preserves the difference between information available at the time and information learned later.
Using too many indicators without defined roles
Adding more displays does not automatically create better analysis. Each feature should have a clear purpose in the review. If two tools provide similar information, explain why both are being used. Otherwise, the chart may become crowded while the decision process remains unclear.
A practical review template
The following template can be copied into a journal and adjusted to suit an individual process. It is intentionally descriptive rather than a recommendation to take a particular market action.
- Date and time: Record when the chart was reviewed.
- Instrument and timeframe: Identify the chart and the timeframe examined.
- Indicator event: Describe the buy or sell indication and where it appeared.
- Trend context: Describe the broader directional condition.
- Momentum context: State whether momentum supports, weakens or does not clarify the indication.
- Structure context: Record relevant BOS, CHoCH or other visible events.
- Flow and smart money context: Note alignment, conflict or uncertainty.
- Unanswered questions: List what still needs to be observed or clarified.
- Next review point: State what would prompt another review and what would make the current view invalid.
- Follow-up: Complete a separate note later about what changed and what was learned about the process.
A template is not a substitute for judgment. Its value comes from making the same important questions visible each time a chart is reviewed.
Final perspective
The search for the Best trading indicator buy and sell should not be reduced to finding a label that appears to make decisions automatically. A more useful question is whether a trading indicator helps you examine market conditions in a structured, repeatable way. When an indication is documented alongside trend, momentum, market structure, flow-related context and unanswered questions, it becomes part of an analytical process rather than an isolated command.
The AKMelytics Smart Money Indicator can fit that process through its described TradingView features, including multi-timeframe analysis, structure events, dashboard context and configurable alerts. The trader remains responsible for interpreting the information, considering uncertainty and applying personal rules. Written reviews help keep those responsibilities visible while creating a record that can be improved over time.
Frequently asked questions
What is the role of a buy and sell indicator in a chart review?
It can draw attention to a potential market condition or setup. In a written process, the indication should start further analysis rather than act as an automatic instruction to buy or sell.
What should I record when an indicator produces a signal?
Record the signal type, time, timeframe and chart location, then describe trend, momentum, market structure, flow-related context, uncertainty and the next review point.
Can a trading indicator confirm that a trade will be profitable?
No. An indicator can organize technical information and support analysis, but it cannot guarantee profits, eliminate losses or predict future results with certainty.
How should I handle conflicting indicator information?
Write down the conflict clearly. For example, note when a buy indication agrees with the broader trend but momentum is weakening. The disagreement is part of the analysis, not a problem to hide.
How can TradingView alerts fit into a written process?
Use an alert as a prompt to open the chart and complete the review. Check the surrounding context before treating the event as meaningful within your own rules.
What features of the AKMelytics Smart Money Indicator can be reviewed?
The supplied description includes trend, momentum, market structure, market flow, relative strength, smart money concepts, multi-timeframe analysis, Fibonacci projections, volatility-based reference levels, dashboard context and alerts.
Is this type of indicator financial advice?
No. The indicator is positioned as a technical analysis and decision-support tool. Traders must interpret the information themselves and should not treat it as personalized financial advice.


Recent Comments