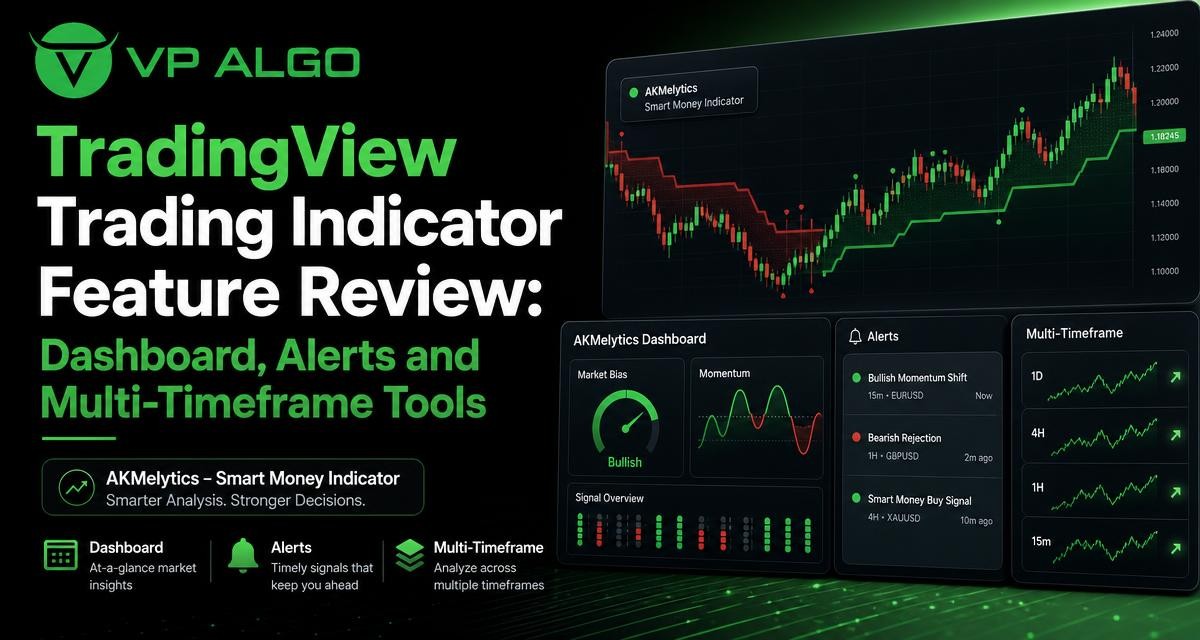
A TradingView trading indicator is most useful when it helps turn a crowded chart into a structured review process. AKMelytics – Smart Money Indicator is designed for that purpose, bringing together trend analysis, momentum evaluation, market structure, market flow, relative strength, smart money concepts, dashboard context, multi-timeframe analysis and configurable TradingView alerts. This feature review explains what each part can contribute to chart analysis and the practical questions traders can ask before considering a setup.
What is AKMelytics – Smart Money Indicator?
AKMelytics – Smart Money Indicator is a technical analysis tool for TradingView. Rather than focusing on a single reading, it combines several analytical areas in one indicator. These include trading algorithms for momentum and trend analysis, market structure events such as Break of Structure (BOS) and Change of Character (CHoCH), market flow, relative strength, Fibonacci projections, volatility-based target and risk reference levels, and smart money analysis.
That combination can be useful for traders who want a repeatable way to inspect charts. It does not remove the need for interpretation. Instead, the indicator is intended to support the review of potential trading setups and help users organise information before making their own decisions. VP ALGO TRADING positions its tools for educational and trading-decision assistance purposes, not as financial advice or a promise of a particular result.
Why a combined TradingView trading indicator can help with chart review
Chart analysis often becomes difficult when several separate tools produce disconnected information. One indicator may show momentum, another may mark structure, and manual drawings may be used for projections. The challenge is not simply finding more signals. It is understanding how different observations relate to the same market context.
A combined TradingView trading indicator can provide a more consistent checklist. For example, a trader may first review the broader trend, then examine momentum, identify important structure events, check whether lower-timeframe activity agrees with the wider picture, and finally consider potential reference levels. This sequence encourages analysis before action.
| Feature area | Question it can help organise | What to examine carefully |
|---|---|---|
| Trend analysis | What direction or bias is visible on the selected chart? | Whether the trend agrees with the wider market context and timeframe |
| Momentum | Is current movement showing strength, weakness or change? | Whether momentum confirms price structure instead of being viewed alone |
| Market structure | Has price produced a BOS or CHoCH event? | The location and significance of the event on the chart |
| Multi-timeframe analysis | Do different chart timeframes provide a consistent view? | Conflicting signals and the reason for the conflict |
| Alerts | Which conditions deserve later attention? | The alert condition, timing and the need for manual confirmation |
Dashboard context: starting with the bigger picture
A dashboard can be valuable because it gives traders a quick place to review several aspects of the chart. In the AKMelytics indicator, dashboard context is part of a wider feature set that includes trend, momentum, market structure, market flow and multi-timeframe assessment. The purpose is not to replace the chart. It is to make the first review more deliberate.
When using dashboard information, begin with context rather than searching immediately for a buy or sell indication. Ask what the dashboard is showing about the current trend, whether momentum appears aligned with that trend, and whether the market structure supports the same interpretation. If the readings disagree, that disagreement is itself useful information. It may indicate consolidation, a transition between conditions or a need to wait for clearer evidence.
Questions to ask when reading the dashboard
- What is the dominant trend on the timeframe being reviewed?
- Does momentum support the apparent trend, or is it showing hesitation?
- Are market structure events consistent with the broader direction?
- Does the multi-timeframe view show alignment or conflict?
- Is the current chart condition clear enough to justify deeper manual analysis?
A dashboard should be treated as a summary of analytical inputs, not as an automatic decision-maker. Experienced traders may use it to speed up an initial scan, while newer traders can use the displayed categories as a learning framework. In both cases, the chart remains the place where price behaviour, structure and context must be examined.
Trend and momentum analysis in one workflow
Trend and momentum answer related but different questions. Trend analysis focuses on direction and structure over a selected period. Momentum evaluation focuses more on the strength or persistence of current movement. A market can have an upward trend while short-term momentum weakens, or it can show strong momentum during a move that has not yet established a broader trend.
AKMelytics combines trend analysis with momentum-related tools, allowing traders to compare these two observations instead of treating either one as sufficient by itself. Someone looking for a momentum indicator for TradingView may find this combined approach more practical than viewing momentum in isolation. The key is to ask whether momentum is confirming the trend, challenging it or simply reflecting a temporary move.
Using momentum as a confirmation question
Momentum can be used as a question rather than a command. If the chart is trending upward, does the momentum reading support continued strength? If the trend is unclear, is momentum helping identify a developing move or revealing that the market is still indecisive? These questions help prevent a single reading from becoming an automatic entry rule.
Relative strength and market flow can add further context to that review. They may help traders examine whether the current movement has supporting characteristics, but they should still be interpreted alongside price action, structure and the selected timeframe. No indicator reading can guarantee that a market will continue in the same direction.
Market structure: BOS and CHoCH events
Market structure is central to many smart money concepts. AKMelytics includes BOS and CHoCH structure events to help traders identify notable changes in how price is behaving. A Break of Structure may be reviewed as evidence that price has moved beyond a prior structural point. A Change of Character may be examined as a possible shift in behaviour.
These labels are useful starting points, but the label alone is not the complete analysis. Traders should inspect where the event occurred, which swing or level was involved, what the higher timeframe is showing and whether momentum agrees with the structural interpretation. The same type of event can have different meaning in a strong trend, a range or a period of choppy price movement.
A practical structure review
- Identify the timeframe on which the BOS or CHoCH event appears.
- Look at the price area that was broken or changed.
- Compare the event with the wider trend and higher-timeframe structure.
- Check whether momentum, flow or relative strength supports the interpretation.
- Consider whether the market has followed through or quickly returned to the previous range.
This process keeps structure events in context. It also helps distinguish between noticing an event and forming a reasoned view about what the event may mean. The indicator can make the event easier to find, while the trader remains responsible for evaluating its relevance.
Multi-timeframe analysis for a more complete view
Multi-timeframe analysis is one of the most practical features to consider in a TradingView trading indicator. A single chart may show a short-term move that looks compelling, while a broader timeframe reveals that price is moving into a larger area of resistance, support or uncertainty. Reviewing more than one timeframe can reduce the risk of basing the entire analysis on a narrow view.
AKMelytics includes multi-timeframe trend assessment. This gives traders a way to compare the selected chart with broader or shorter-term trend information. The goal is not to force every timeframe to agree. Markets frequently show different conditions across timeframes. Instead, the comparison can clarify whether a potential setup is aligned with the broader trend, counter to it or caught between conflicting signals.
| Multi-timeframe situation | Useful interpretation question | Practical response |
|---|---|---|
| Higher and lower timeframes agree | Does price structure also support the same direction? | Continue with detailed validation rather than treating alignment as a guarantee |
| Higher timeframe is directional, lower timeframe is mixed | Is the lower-timeframe movement a pullback, consolidation or reversal attempt? | Wait for clearer structure and momentum context |
| Higher timeframe and lower timeframe conflict | Which timeframe matches the intended holding period? | Define the analysis horizon before interpreting the signal |
| Several timeframes are unclear | Is there enough information to form a disciplined view? | Consider remaining selective until conditions become clearer |
The correct timeframe hierarchy depends on the trader’s own method and intended holding period. A short-term chart and a broader chart may serve different purposes. Multi-timeframe tools are most helpful when the user has already decided what each timeframe is meant to answer.
Alerts: monitoring conditions without watching every candle
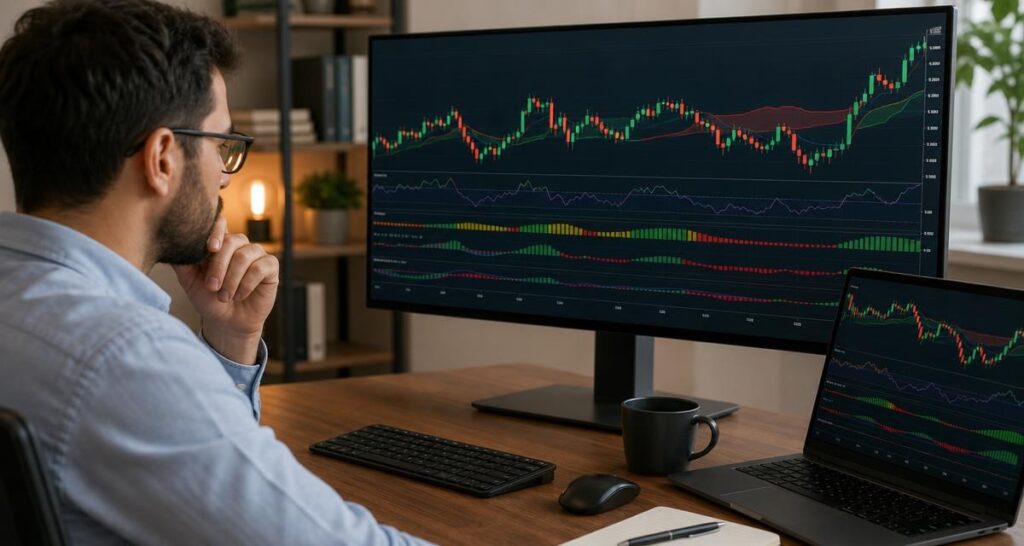
Configurable TradingView alerts can help traders monitor selected conditions without constantly observing the chart. In AKMelytics, alerts are part of the indicator’s broader feature set. They may be useful for drawing attention to a structure event, trend development or another configured condition that warrants review.
An alert should be treated as a notification to investigate, not as an instruction to trade. When an alert arrives, review the chart at the relevant timeframe, check the surrounding price action, compare the broader trend and examine whether momentum and structure support the same reading. This is particularly important when a notification occurs during volatile or rapidly changing conditions.
Building a sensible alert routine
- Choose conditions that matter to the trading process rather than enabling every available notification.
- Record which timeframe and chart produced the alert.
- Review the surrounding market structure instead of focusing only on the alert candle.
- Compare the alert with higher-timeframe trend context.
- Use independent risk and trade-planning rules before considering any action.
Alerts can improve attention management, but they do not solve the problem of overtrading. A trader who reacts to every notification may simply replace constant chart-watching with constant alert-watching. A written review process helps keep alerts in their proper role.
Fibonacci projections and volatility-based reference levels
AKMelytics includes Fibonacci projections and volatility-based target and risk reference levels. These features can assist with planning by highlighting areas that a trader may want to examine when assessing a potential setup. They are reference tools, not guaranteed destinations or fixed predictions of future price behaviour.
Fibonacci projections should be considered alongside the market structure that created the measured move. A projection may be more informative when it relates to a clear swing, but it still requires contextual review. Similarly, volatility-based levels can help frame a chart’s current movement and provide reference points for planning, while actual market conditions may change quickly.
Using these levels responsibly means asking what they are based on, whether the underlying structure remains valid and how they fit the trader’s broader risk process. The presence of a projected level does not by itself establish a trade opportunity, an expected outcome or an appropriate position size.
How to review a potential setup with the indicator
A feature-rich indicator is easier to use when the review process is consistent. The following sequence can help traders move from broad context to detailed chart inspection.
- Define the review timeframe. Decide whether the chart is being used for broader direction, setup analysis or a shorter-term decision.
- Read the dashboard context. Review trend, momentum, flow and other available categories before focusing on a single event.
- Inspect market structure. Check for BOS or CHoCH events and examine the price action around them.
- Compare timeframes. Determine whether the broader and shorter-term views agree, conflict or remain unclear.
- Review reference levels. Examine Fibonacci projections and volatility-based target or risk reference levels as planning aids.
- Check alerts and timing. If an alert triggered the review, confirm the condition and assess whether the market has changed since it appeared.
- Apply independent risk rules. Decide whether the situation fits the trader’s own plan without treating the indicator as financial advice or a guarantee.
This workflow is intentionally cautious. It encourages the trader to combine multiple observations and recognise uncertainty rather than searching for a single perfect signal. It can also make post-trade or post-review journaling more useful because each part of the analysis has a defined place.
Who may find this TradingView indicator useful?
AKMelytics may suit TradingView users who want trend, momentum, structure, flow and smart money concepts brought together in one analytical tool. Beginners may appreciate having a structured set of chart questions, while more experienced traders may use the dashboard, multi-timeframe context and alerts to support an existing process.
The indicator is less suitable for anyone expecting an automatic system that removes analysis or guarantees profitable outcomes. It is a tool for reviewing potential setups and supporting trading decisions. Users should understand the features, test how they fit their own workflow and maintain their own approach to risk and uncertainty.
Access, installation and support information
VP ALGO TRADING offers the AKMelytics – Smart Money Indicator for TradingView. The website also offers a request-based 7-day free trial for its indicator and Telegram channel. Trial details and eligibility should be confirmed directly with the company rather than assumed from a general product description.
After purchase, customers are instructed to provide their TradingView ID by email for product access. Support is available for installation, activation or usage assistance. Because access and setup can depend on the user’s TradingView account details, providing the requested information accurately can help the activation process proceed more smoothly.
Final assessment
AKMelytics – Smart Money Indicator brings together several chart-review functions that traders often examine separately. Its dashboard context can support an initial scan, momentum and trend features can encourage confirmation, BOS and CHoCH events can focus attention on market structure, and multi-timeframe analysis can reveal whether a view is broadly aligned or in conflict. Configurable alerts add a monitoring layer, while Fibonacci projections and volatility-based levels provide additional reference points.
The strongest use of a TradingView trading indicator is not to outsource judgment. It is to make the review process more organised and repeatable. Traders should interpret the information in context, verify what each feature is showing and apply their own risk decisions. The indicator is designed to support analysis and decision-making, not to provide financial advice or promise a particular trading result.
Frequently asked questions
What is the AKMelytics – Smart Money Indicator?
It is a TradingView technical analysis tool that combines trend analysis, momentum, market structure, market flow, relative strength, smart money concepts, multi-timeframe analysis, alerts and reference levels.
Is AKMelytics a momentum indicator for TradingView?
It includes momentum analysis as part of a broader indicator. It is not limited to momentum because it also covers trend, structure, flow, smart money concepts and other chart-review features.
What do BOS and CHoCH mean in the indicator?
BOS refers to Break of Structure and CHoCH refers to Change of Character. The indicator marks these types of structure events so traders can investigate changes in price behaviour and context.
Can the indicator analyse more than one timeframe?
Yes. The indicator includes multi-timeframe trend assessment. Traders can use that information to compare broader and shorter-term conditions, while still interpreting conflicting readings carefully.
Do the alerts tell me when to trade?
No. Alerts are notifications for configured conditions that deserve review. They should not be treated as automatic trade instructions or as a guarantee of a particular outcome.
Does the indicator guarantee profitable results?
No. The indicator does not eliminate trading losses or guarantee profits. It is intended to support technical analysis and trading-decision assistance, not to provide financial advice.
How do customers receive access after purchase?
Customers are instructed to provide their TradingView ID by email after purchase. They can also contact VP ALGO TRADING for installation, activation or usage assistance.


Recent Comments