
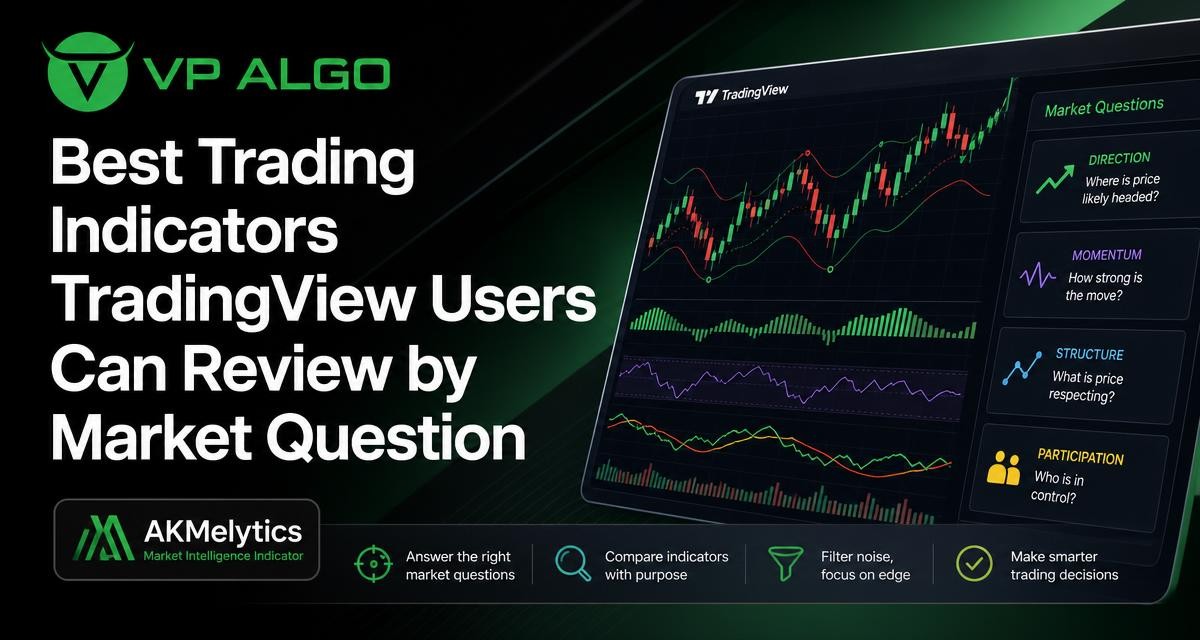
Searching for the best trading indicators TradingView users can add to a chart often leads to a long list of tools with different purposes. A more useful approach is to start with the market question you want to answer: Is price trending? Is momentum strengthening? Has market structure changed? Is there evidence of meaningful participation? Reviewing indicators this way makes comparison clearer and reduces the temptation to treat one tool as a universal answer.
Why the best indicator depends on the question
Trading indicators do not all measure the same part of market behaviour. A trend indicator may help describe direction, while a momentum tool focuses on the speed or persistence of price movement. A market structure indicator can help organise swing relationships, and a participation or institutional-flow tool may provide another perspective on activity behind a move.
That means “best” is usually a question of fit rather than a permanent ranking. The right TradingView trading indicator should match the decision you are trying to make, the timeframe you are reviewing and the way you interpret price action. It should also be clear enough to use consistently without covering the chart with conflicting signals.
A practical framework for comparing TradingView indicators
Before comparing individual tools, define the job each indicator is expected to perform. This avoids choosing an indicator because it appears popular, has many visual elements or produces frequent buy and sell markers.
| Market question | Indicator category to review | What to examine |
|---|---|---|
| What is the broader direction? | Trend indicator | Whether the tool presents direction clearly and how it behaves during sideways conditions |
| Is the move gaining or losing strength? | Momentum indicator | Whether momentum changes are easy to distinguish from ordinary price noise |
| Has the price structure changed? | Market structure indicator | How swings, breaks and possible shifts in structure are displayed |
| Is there evidence of meaningful participation? | Flow or smart money analysis | What activity-related information the tool provides and how it fits with price action |
| How do conditions differ across timeframes? | Multi-timeframe analysis | Whether higher- and lower-timeframe information can be reviewed without confusion |
This framework does not turn an indicator into a decision-maker. It gives traders a consistent method for asking whether a tool is understandable, relevant and suitable for their analysis process. The result is often more useful than searching for a single indicator that promises to answer every question.
1. When the question is direction: review trend indicators
A trend indicator for TradingView is designed to help traders assess whether price is generally moving upward, downward or without a clear directional bias. Depending on the tool, this may be represented through lines, zones, colour changes, trend states or other chart elements. The central evaluation question is simple: does the indicator make the prevailing direction easier to interpret?
When reviewing a trend tool, look beyond how often it changes colour or produces a signal. Consider how it behaves during consolidations, pullbacks and transitions. A tool that changes direction repeatedly during a range may be difficult to use, while a tool that reacts very slowly may not show a developing shift promptly enough for your process. The useful balance depends on the timeframe and the type of analysis being performed.
- Check whether the trend display is clear at the chart scale you normally use.
- Review how the indicator handles pullbacks within a broader move.
- Observe whether sideways price action creates repeated directional changes.
- Use the indicator as one part of analysis rather than assuming direction alone identifies a complete setup.
2. When the question is strength: review momentum indicators
A momentum indicator for TradingView can help traders examine whether a price move is gaining strength, losing force or moving with limited conviction. Momentum is different from direction. A market may still be rising while upward momentum weakens, or price may move lower with increasing momentum after a change in conditions.
The best way to compare momentum tools is to examine how their readings relate to actual price behaviour. Ask whether the indicator helps you identify acceleration, deceleration or a possible loss of follow-through. Also consider whether its signals are easy to interpret across different market conditions. A momentum reading should not be treated as proof that price must reverse or continue; it is an additional lens for evaluating the move.
What to look for in a momentum tool
- A readable method for showing strengthening and weakening momentum.
- Context that helps separate a strong move from a short-lived price burst.
- A presentation that does not encourage traders to act on every small fluctuation.
- Compatibility with your broader trend and structure review.
Momentum analysis becomes more useful when it is combined with a clear question. For example, a trader may ask whether a pullback is losing force before considering how it fits into the wider structure. That is more precise than treating every momentum change as an automatic buy or sell instruction.
3. When the question is structure: review a market structure indicator
A market structure indicator helps organise the relationships between price swings. Traders may use structure analysis to review areas such as higher highs, lower lows, breaks in an established sequence and potential changes in directional conditions. The value of the indicator depends on whether it makes these relationships easier to see without replacing careful chart interpretation.
When comparing market structure tools, examine how they identify and display important swing points. A useful presentation should help you distinguish a meaningful structural development from ordinary short-term movement. It is also worth checking whether the chart becomes crowded with labels and lines. If the display is difficult to read, the additional information may not improve the analysis.
Questions to ask about structure indicators
- How does the tool define or display a swing?
- Can you distinguish a structural break from a minor fluctuation?
- Does the presentation remain readable across the timeframes you use?
- Can the indicator be considered alongside trend and momentum rather than viewed in isolation?
- Does it help you document a repeatable analysis process?
Structure is particularly useful as an organising framework. It can provide a way to describe what price has done, but it cannot remove uncertainty about what price will do next. Traders should therefore treat structure readings as analysis rather than a guarantee of continuation or reversal.
4. When the question is participation: review flow and smart money concepts
Some traders want to examine more than price direction and momentum. They also want to consider institutional activity, smart money concepts or other forms of participation analysis. An institutional flow indicator or smart money indicator may be used to add this perspective to the chart, provided the trader understands what the tool is actually showing.
When reviewing this category, avoid judging an indicator solely by the number of labels it places on a chart. Instead, ask what information the labels represent, how that information relates to price and whether the display supports a consistent interpretation. Participation analysis should add context, not create the impression that the actions of a particular market group can be known with certainty from a single chart signal.
VP ALGO TRADING develops TradingView indicators and algorithmic trading tools that address several of these analysis needs. Its supplied product context describes features related to trend analysis, momentum evaluation, market structure, institutional activity, multi-timeframe trend assessment and smart money analysis. For traders comparing tools, that combination may be relevant when the goal is to review several market questions in one structured workflow rather than switching between unrelated indicators.
5. When the question is alignment: review multiple timeframes
A market can look bullish on one timeframe and corrective or uncertain on another. Multi-timeframe analysis helps traders organise those different views. The key is not to force every timeframe to show the same signal. Instead, review whether the broader context and the more detailed chart are telling a coherent story or highlighting a conflict that deserves caution.
When evaluating an indicator with multi-timeframe features, check how clearly it separates the information from each timeframe. You should be able to identify which reading describes the broader context and which relates to the shorter-term chart. If the display blends everything together, it may be harder to understand what has changed and why.
| Review level | Useful question | Potential role in analysis |
|---|---|---|
| Broader timeframe | What is the larger directional or structural context? | Provides background for interpreting shorter-term movement |
| Working timeframe | What is price doing within that context? | Helps organise the current trend, momentum and structure |
| Shorter timeframe | Is there a more detailed change that affects the immediate view? | Shows local movement that may support or conflict with the broader picture |
How to compare free and paid TradingView indicators
Free indicators can be useful for learning the basics of trend, momentum and structure. They may also suit traders who prefer to assemble their own charting process from separate tools. A paid indicator may be worth reviewing when a trader values a more integrated presentation, specialised analysis features or a workflow that reduces the need to configure several separate studies.
The important comparison is not simply free versus paid. Consider the clarity of the information, the features relevant to your market questions, the quality of documentation and whether the tool fits the way you already analyse charts. A paid tool should still be evaluated carefully. Cost alone does not prove that an indicator is more accurate or more suitable for every trader.
- Identify which analysis questions the tool is designed to address.
- Check whether the chart display is understandable before relying on it.
- Review installation and access requirements for the TradingView account.
- Determine whether support is available for installation, activation or usage questions.
- Use a structured review period to decide whether the tool fits your process.
VP ALGO TRADING states that its website offers a request-based seven-day free trial for its indicator and Telegram channel. Product access instructions state that customers provide their TradingView ID by email after purchase, with support available for installation, activation or usage assistance. Traders should confirm current conditions and access details directly with the company before making a decision.
How to avoid common indicator comparison mistakes
Choosing based only on signal frequency
A chart filled with frequent signals can appear active, but more signals do not automatically mean better analysis. Frequent alerts may reflect ordinary market noise, especially when price is moving sideways. Evaluate whether each signal answers a useful question and whether you can explain why it matters.
Combining too many overlapping tools
Using several indicators that measure similar information can create the appearance of confirmation without adding much independent insight. For example, multiple trend tools may all react to the same price movement. A cleaner chart often results from selecting tools with different but complementary roles, such as direction, momentum and structure.
Treating an indicator as a prediction engine
Indicators summarise or transform market information. They do not remove uncertainty, guarantee an outcome or eliminate trading losses. Technical analysis is best used as part of a defined process that includes context, risk awareness and decisions appropriate to the trader’s own circumstances.
Ignoring the way the indicator is built
Before relying on a signal, learn what the tool measures, how it displays changes and whether some readings may update as new price information appears. Understanding the indicator’s logic helps prevent overconfidence and makes it easier to use the tool consistently.
Where a combined market intelligence indicator may fit
Some traders prefer separate tools for each task, while others want a more integrated view. A market intelligence indicator that brings together trend, momentum, market structure, institutional activity, multi-timeframe trend assessment and smart money analysis may suit traders who want these perspectives organised in one TradingView workflow.
The decision should still be based on fit. Review each feature separately, learn how the readings are presented and consider whether the combined display helps you answer questions more clearly. VP ALGO TRADING positions its indicators as educational and trading-decision assistance tools, not as financial advice. No indicator should be treated as a promise of profitable results or as a substitute for independent judgment.
A simple review process for choosing an indicator
- Write down the main market question you need the indicator to answer.
- Select the relevant category, such as trend, momentum, structure or participation.
- Review the chart display on the timeframes relevant to your analysis.
- Compare the indicator’s readings with price action rather than judging signals alone.
- Note how the tool behaves during trends, pullbacks and sideways conditions.
- Decide whether the information improves your process without creating unnecessary chart clutter.
- Document how you interpret the tool before using it as part of a regular routine.
This process keeps the search for the best trading indicators TradingView users can review focused on usefulness. The strongest choice is not necessarily the tool with the most features. It is the one that presents relevant information clearly and supports a disciplined way to analyse market conditions.
Frequently asked questions
What are the best trading indicators TradingView users can review?
There is no single best indicator for every trader or market question. Trend, momentum, market structure and participation tools serve different purposes, so the best choice depends on the information you need and how it fits your analysis process.
What does a market structure indicator do?
A market structure indicator helps organise price swings and may display relationships such as directional sequences or potential structural changes. It should be used to support chart analysis, not as a guarantee of future movement.
Is a smart money indicator the same as a trend indicator?
No. A trend indicator focuses mainly on directional conditions, while a smart money indicator may provide a perspective related to institutional activity or smart money concepts. The two categories can address different questions.
Are free TradingView indicators suitable for beginners?
Free indicators can be suitable for learning basic concepts and building a simple charting process. Beginners should first understand what an indicator measures and how it behaves in different market conditions rather than selecting tools based only on popularity.
Can one TradingView indicator cover trend, momentum and structure?
Some indicators are designed to combine several analysis features. VP ALGO TRADING’s supplied product context describes an indicator offering with features related to trend analysis, momentum, market structure, institutional activity, multi-timeframe assessment and smart money analysis.
Does a buy and sell indicator guarantee profitable trades?
No. A buy and sell indicator cannot guarantee profits or eliminate losses. Signals should be interpreted within a broader process that considers market context, uncertainty and the trader’s own risk decisions.
How should I test a TradingView indicator before relying on it?
Learn what it measures, review its display across relevant conditions and compare its readings with price action. Document how you interpret it and confirm that it improves your analysis without encouraging automatic decisions.


Recent Comments