
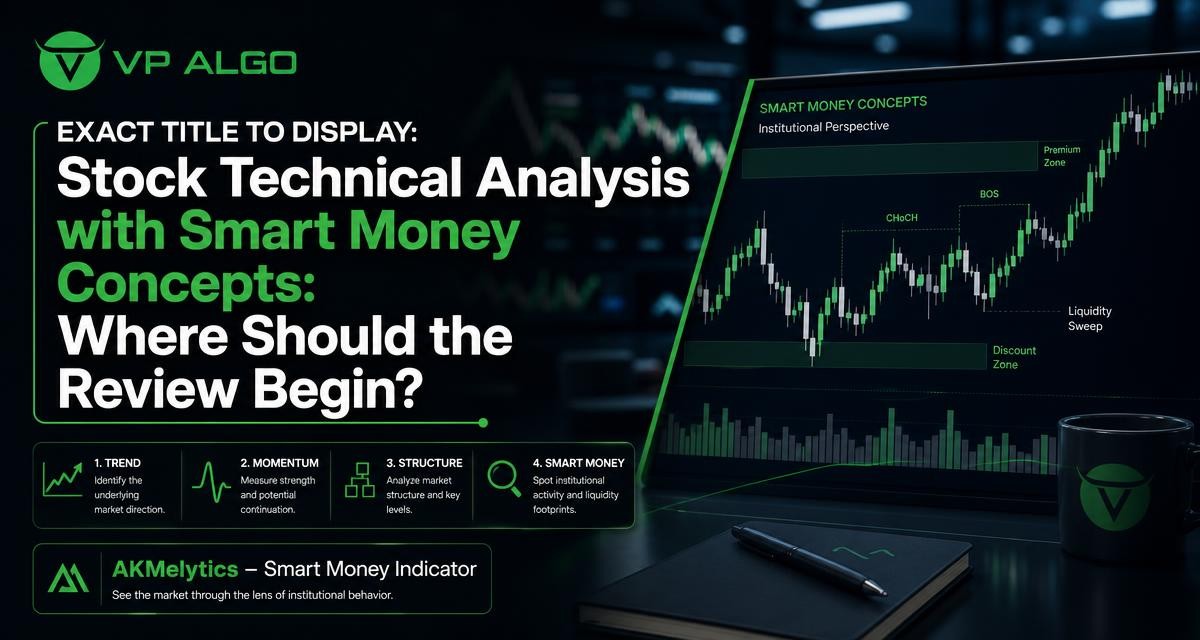
Stock technical analysis becomes more useful when it follows a clear sequence instead of jumping between indicators. A practical review can begin with the broader trend, move to momentum, examine market structure, and then use smart money concepts to add context around potential areas of interest. This process does not predict outcomes or remove trading risk, but it can help traders organize the information visible on a chart.
Why the order of analysis matters
A chart can display trend lines, oscillators, support and resistance, candlestick patterns, volume-related observations and several alerts at the same time. The challenge is rarely a lack of information. It is deciding which information should be considered first and how each observation relates to the others.
Starting with a narrow signal can lead to a broader market condition being overlooked. For example, a short-term momentum change may appear while the larger trend remains firmly directional. Conversely, a structural break may deserve more attention when it occurs after an extended move and is supported by a change in momentum. A defined sequence helps separate context from confirmation.
| Review stage | Main question | What to observe |
|---|---|---|
| Trend | What is the broader directional condition? | Higher highs, lower lows, moving direction and multi-timeframe alignment |
| Momentum | Is participation supporting the current move? | Strength, weakening pressure, acceleration and divergence-style observations |
| Market structure | Has the price sequence changed? | Break of Structure, Change of Character, swing points and key levels |
| Smart money context | Where may important activity be concentrated? | Liquidity areas, reactions, flow observations and zones of interest |
| Decision process | Does the setup meet the trader’s rules? | Timeframe, invalidation, risk reference and alert conditions |
Step one: establish the trend before studying entries
Trend analysis provides the initial framework for stock technical analysis. Rather than asking immediately whether price should be bought or sold, begin by asking whether the chart is showing an advancing, declining or less directional condition. The answer may differ across timeframes, so the review should specify which timeframe is being used for context and which is being used for execution.
Use multiple timeframes for context
A higher timeframe can show the dominant structure, while a lower timeframe can reveal shorter-term movement inside that structure. A lower-timeframe rally does not necessarily mean the broader market has changed direction. It may simply be a retracement within a larger decline. Likewise, a short-term pullback can occur inside a wider advance.
Multi-timeframe analysis is therefore less about finding identical signals everywhere and more about understanding the relationship between them. A trader may use the higher timeframe to define the general environment, then use a lower timeframe to study momentum and structural behavior. The chosen combination should be consistent with the trader’s own method and holding period.
Questions to ask during trend analysis
- Are recent swing highs and lows generally advancing or declining?
- Is the current price movement consistent with the broader timeframe?
- Is the market trending clearly, or is it moving inside a range?
- Has price reached a level where the existing trend may pause or react?
- Would a new signal be following the trend or attempting to anticipate a reversal?
These questions help prevent an isolated indicator reading from becoming the entire analysis. Trend direction is not a guarantee of continuation. It is a starting point for interpreting the information that follows.
Step two: review momentum without treating it as a standalone signal
Momentum analysis examines the strength and pace of a move. It can help show whether a trend is being supported, losing force or changing character. Momentum should be interpreted alongside price structure because a strong reading does not explain where price is located or whether an important level is nearby.
For example, rising momentum during an established advance may support the view that buyers remain active. However, if price is approaching a significant swing area, the same momentum reading does not by itself establish what happens next. A weakening momentum observation may indicate caution, but it does not automatically confirm a reversal.
What momentum can add to a review
- Confirmation: Momentum can support a directional move already visible in the trend and structure.
- Early caution: A loss of momentum may encourage closer attention to the next structural event.
- Comparison: Momentum can help distinguish a forceful move from a slower, less convincing one.
- Timing context: A momentum shift may prompt a trader to wait for additional evidence rather than react immediately.
One common mistake is to use an overextended or weakening momentum reading as an automatic buy or sell instruction. A market can remain strong while momentum readings look elevated, and it can remain weak after an initial bounce. The role of momentum is to add evidence to the review, not replace the review.
Step three: map market structure and identify meaningful changes
Market structure focuses on the sequence of price swings. It asks how highs, lows and breaks relate to one another. This is where the review becomes more specific: instead of describing price as simply rising or falling, the trader studies whether the established sequence is continuing or changing.
Break of Structure and Change of Character
A Break of Structure, often abbreviated as BOS, is commonly used to describe a break that supports continuation of an existing directional sequence. A Change of Character, or CHoCH, is commonly used to describe a structural shift that may signal a change in behavior. The exact rules for marking these events can differ between trading methods, so labels should be understood within the settings and definitions being used.
Neither event should be treated as a guaranteed reversal or continuation signal. A structural break can occur briefly and fail to develop. A CHoCH may be an early warning rather than confirmation of a new trend. Reviewing the location of the event, the higher-timeframe context and the accompanying momentum can make the interpretation more disciplined.
How to study structure on a chart
- Mark the relevant swing highs and lows on the timeframe being reviewed.
- Describe the current sequence in plain language, such as advancing, declining or ranging.
- Note whether price has broken a previous swing or merely tested it.
- Check whether the break is supported by momentum and the wider trend.
- Define what future price behavior would invalidate the current structural interpretation.
This process is useful because it turns vague impressions into a testable chart narrative. It also reduces the temptation to assign meaning to every small fluctuation.

Step four: bring smart money concepts into the review
Smart money concepts are often used to discuss liquidity, market structure, institutional-style activity and areas where price may attract attention. In practice, these concepts should be treated as a framework for observation rather than proof that a particular participant has entered or exited a position. Chart-based tools can present clues and calculated conditions, but they cannot establish the intentions of every market participant.
Liquidity and areas of interest
Traders using smart money concepts may study areas around prior highs, lows, equal levels and other locations where orders or attention could be concentrated. The purpose is to ask what price might be testing and how it reacts there. A reaction alone is not enough; the trader can also examine whether momentum, structure and the higher timeframe agree with the interpretation.
It is helpful to distinguish between a level being visible and a trade being justified. A visible level may be worth monitoring without creating an immediate setup. Waiting for a defined response can help avoid treating every liquidity observation as a signal.
Institutional activity and flow observations
Some smart money tools include observations related to market flow or institutional activity. These should be read as analytical context, not as direct access to private order information. The strongest use of such observations is to compare them with price behavior: does the apparent flow context agree with the trend, momentum and structure, or does it create a reason to pause?
This distinction matters because smart money terminology can sound more certain than the underlying evidence. A disciplined review uses the concepts to generate questions, then checks those questions against the chart and the trader’s predefined rules.
How the four layers work together
The sequence becomes most useful when each layer has a separate job. Trend describes the wider direction. Momentum evaluates strength. Structure identifies the current price sequence and possible changes. Smart money concepts add context around liquidity and areas where a reaction may deserve attention.
| If the chart shows… | A reasonable next question |
|---|---|
| Trend and momentum agree | Is market structure continuing, and is price near a suitable area for further review? |
| Trend is positive but momentum is weakening | Is this a normal pause, or is a structural change developing? |
| Trend and structure disagree across timeframes | Which timeframe is relevant to the planned holding period, and what is the risk of conflicting context? |
| A liquidity area is tested | What reaction, if any, would confirm or reject the current interpretation? |
| A BOS or CHoCH appears | Does the event have support from location, momentum and the broader trend? |
This approach does not require every category to produce the same answer. Conflicting information can be valuable because it signals uncertainty. In those situations, the appropriate response may be to wait, reduce complexity in the analysis or return to the trader’s rules rather than force a conclusion.
Using a TradingView indicator as an organization tool
A TradingView indicator can help organize several observations on one chart. VP ALGO TRADING’s AKMelytics – Smart Money Indicator is designed to combine elements such as trend analysis, momentum, market structure, market flow, relative strength and smart money concepts. Its described features include multi-timeframe analysis, BOS and CHoCH structure events, Fibonacci projections, volatility-based target and risk reference levels, dashboard context and configurable TradingView alerts.
These features can make a structured review easier to follow, particularly when a trader wants to compare trend, momentum and structure without manually switching between unrelated chart tools. The indicator remains an aid to analysis and decision-making. It does not provide financial advice, guarantee a result or eliminate the need for independent judgment and risk management.
A simple workflow for using chart tools
- Start with the cleanest view available and establish the higher-timeframe trend.
- Review the lower timeframe only after the broader context is clear.
- Use momentum information to assess strength or weakening pressure.
- Study BOS, CHoCH and swing points in relation to important price areas.
- Review smart money and flow observations as supporting context.
- Record the conditions that would confirm, weaken or invalidate the idea.
Alerts can help a trader monitor defined conditions, but an alert is not the same as a complete analysis. Before acting on any notification, review the timeframe, surrounding structure and current market context.
Common mistakes in stock technical analysis
Starting with the signal instead of the context
A buy or sell label may attract immediate attention, but it does not explain the trend, location or risk of conflicting timeframes. Begin with the market condition and use signals as part of the later review.
Using too many indicators without defined roles
Several tools may display similar information, creating the impression of confirmation when they are based on related inputs. Give each tool a clear purpose and remove information that does not improve the decision process.
Assuming smart money terminology provides certainty
Terms such as liquidity, institutional flow and order blocks can be useful analytical concepts, but they should not be treated as proof of future price direction. Require observable confirmation and define invalidation in advance.
Ignoring the difference between analysis and risk management
A well-organized chart review does not make a trade risk-free. Position sizing, risk limits, time horizon and the possibility of loss remain separate decisions. Technical tools can support those decisions, but they cannot remove uncertainty.
A repeatable review checklist
Before completing a stock technical analysis review, use a short checklist to keep the process consistent:
- What is the higher-timeframe trend?
- What is the current lower-timeframe structure?
- Is momentum supporting the move or showing weakness?
- Has a meaningful BOS or CHoCH occurred?
- Are there visible liquidity or smart money areas worth monitoring?
- Do the different observations agree, or is the chart conflicted?
- What would invalidate the current interpretation?
- Does the situation meet the trader’s own risk and execution rules?
Writing the answers down can be more valuable than adding another indicator. A consistent record makes it easier to compare analysis with later outcomes without assuming that a single result proves or disproves the entire method.
Final perspective
The best place to begin stock technical analysis with smart money concepts is usually the broadest useful context. Establish the trend, examine momentum, map market structure and then study liquidity, flow and other smart money observations. This order keeps the analysis connected to price behavior instead of allowing one label or alert to dominate the decision.
Tools such as the AKMelytics – Smart Money Indicator can bring these categories together on TradingView and help traders review potential setups more systematically. The quality of the process still depends on clear rules, suitable timeframes, independent judgment and careful attention to risk. No indicator can guarantee a trading result, so the goal should be a clearer and more repeatable review rather than certainty.
Frequently Asked Questions
What should I review first in stock technical analysis?
Begin with the broader trend and the timeframe relevant to your planned holding period. Then examine momentum, market structure and smart money observations in that order.
What are smart money concepts used for?
Smart money concepts provide a framework for studying liquidity, market structure, flow observations and areas where price may attract attention. They are analytical concepts, not guarantees of future movement.
What is the difference between BOS and CHoCH?
BOS commonly describes a break that supports continuation of an existing structure, while CHoCH commonly describes a possible change in market behavior. Definitions can vary by method, so use consistent rules.
Can momentum confirm a stock trend?
Momentum can support an existing trend by showing strength or weakening pressure, but it should be considered alongside price location and structure rather than used alone.
How can a TradingView indicator support this review?
A TradingView indicator can organize trend, momentum, structure, flow and smart money observations on a chart. It supports analysis but does not replace independent judgment or risk management.
Does a smart money indicator guarantee profitable trades?
No. An indicator cannot guarantee profits, eliminate losses or predict every market movement. It is a tool for evaluating potential setups and decision-making.


Recent Comments