
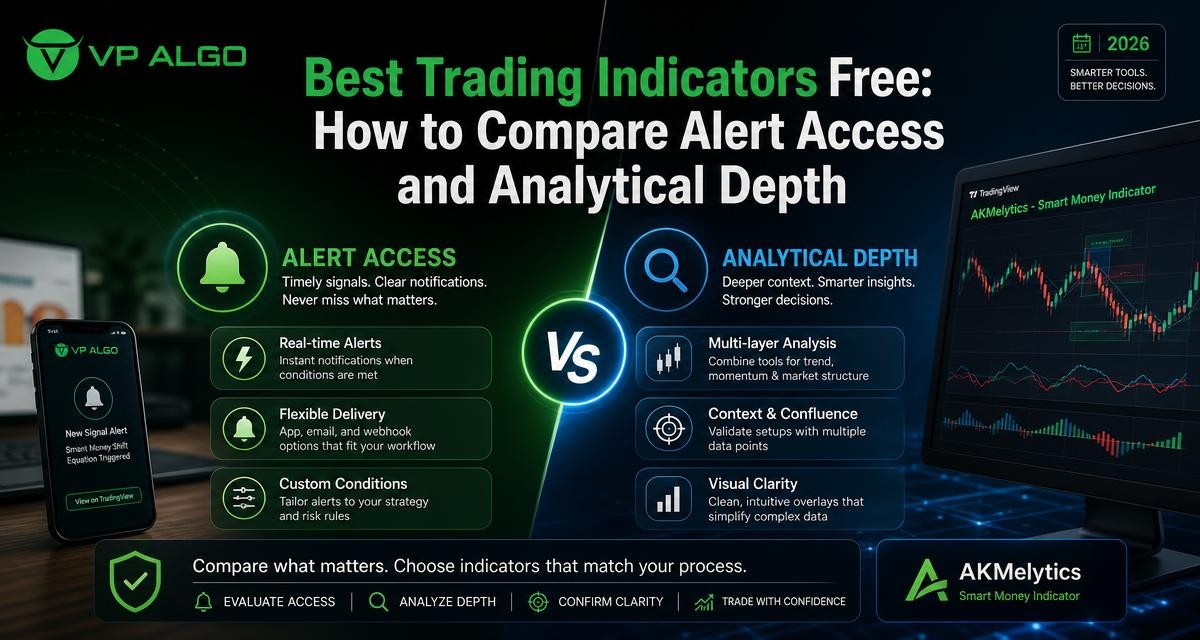
Searching for the best trading indicators free can lead to a long list of tools that appear similar at first glance. A better approach is to compare what each indicator actually shows, how alerts are handled, how much chart context is available, and whether the features support a repeatable analysis process. This matters because an attractive signal alone may not explain the trend, momentum, market structure or conditions surrounding a potential setup.
What “free” should mean when comparing trading indicators
Free can describe several different experiences. It may refer to an indicator that is publicly available, a tool with a limited feature set, a trial period, or a charting feature that does not require an additional purchase. These options are not automatically equivalent. Before comparing tools, define what access you need and which functions are essential to your analysis.
A free indicator may provide a useful starting point for learning technical analysis, but it may offer little explanation of why a signal appears. Another tool may provide more chart context while requiring a request-based trial or a separate purchase for access. The important question is not simply whether a tool costs nothing. It is whether the available features help you evaluate a market condition clearly and consistently.
| Evaluation area | Questions to ask | Why it matters |
|---|---|---|
| Access | Can you view the tool, request a trial, or use only selected features? | It clarifies what you can test before making a decision. |
| Alerts | Can alerts be configured for the events you actually monitor? | Useful alerts can reduce the need to watch every chart continuously. |
| Chart context | Does the indicator show trend, momentum and structure together? | Context helps prevent isolated signals from being read as complete trade ideas. |
| Feature clarity | Are labels, dashboards and settings understandable? | Clear presentation makes it easier to build a repeatable workflow. |
| Decision support | Does the tool support analysis without presenting itself as financial advice? | An indicator should assist research rather than replace judgment and risk management. |
Compare alert access before comparing signal quality
Alerts are one of the most practical differences between TradingView tools. A chart can display a condition, but an alert may notify you when a selected event occurs. That can be useful for traders who monitor several instruments or who do not want to keep every chart open throughout the session.
However, an alert is not the same as a complete trading decision. When reviewing the best trading indicators free, check what triggers an alert and whether the trigger is connected to a clearly defined event. For example, a tool may provide alerts related to a trend condition, a momentum change, or a market structure event. You should also determine whether the alert settings are configurable and whether the chart provides enough surrounding information to interpret the notification.
Questions to ask about TradingView alerts
- What exact event creates the alert?
- Can you select the symbol, timeframe or condition that matters to your workflow?
- Does the alert identify a structural event, a momentum condition or a general directional change?
- Can you review the chart context after receiving the alert?
- Are the labels and notifications clear enough to avoid confusion between different event types?
These questions help separate useful monitoring features from vague signal language. They also encourage a more disciplined process: receive an alert, review the broader chart, and then decide whether the market conditions fit your own plan.
Look for analytical depth, not just buy and sell labels
A simple buy or sell label may be easy to read, but it usually provides limited explanation on its own. Analytical depth refers to the amount of market information an indicator brings together and how clearly it presents that information. Depending on the tool, this may include trend analysis, momentum evaluation, market structure, relative strength, market flow, institutional activity or smart money concepts.
The goal is not to collect as many features as possible. More features can create clutter if they are not connected to a clear method. Instead, consider whether the indicator helps you answer basic questions: What is the prevailing trend? Is momentum supporting or weakening that direction? Has market structure changed? Are there areas or events that deserve closer review?
Trend analysis and momentum
A trend indicator for TradingView can help organize directional information across a chart. Momentum analysis adds another layer by helping you assess whether movement appears to be strengthening, weakening or changing. Neither component should be treated as a guarantee of a future move. Their value is in giving you a structured way to examine price behavior.
When comparing tools, check whether trend and momentum information is shown in a way that can be read quickly without hiding the price chart. A dashboard, visual markers or separate conditions may each work well, depending on your preferred workflow. The key is that the display should support interpretation rather than encourage automatic decisions.
Market structure and smart money concepts
A market structure indicator may identify events such as a break of structure, commonly abbreviated as BOS, or a change of character, commonly abbreviated as CHoCH. These labels can provide a framework for studying how price develops through swings and structural changes. They still require interpretation within the relevant timeframe and surrounding market context.
A smart money indicator may combine structure with concepts related to market flow, institutional activity or areas of interest. These terms should be understood as analytical frameworks, not proof that a particular institution has taken a specific position. When comparing tools, look for clear definitions of the events being displayed and avoid assuming that a label alone confirms a trade outcome.
Why multi-timeframe context can improve evaluation
One timeframe rarely tells the whole story. A broader chart may show the dominant trend while a shorter chart displays momentum changes or local market structure. A TradingView trading indicator with multi-timeframe analysis can help organize these views, provided that the information remains understandable.
For example, you might use a higher timeframe to study general direction and a lower timeframe to examine a potential setup. This does not make the setup valid by itself. It simply gives you a way to compare short-term movement with broader conditions. When testing an indicator, note whether its multi-timeframe information is clearly identified and whether the chosen timeframes can be adjusted to suit your method.
| Context layer | What to examine | Useful review question |
|---|---|---|
| Higher timeframe | Broad trend and major structural direction | Is the shorter-term movement aligned with or opposed to the wider context? |
| Working timeframe | Momentum, structure and possible areas of interest | What conditions are visible on the chart being used for analysis? |
| Lower timeframe | More detailed price behavior and event timing | Does the additional detail improve clarity or simply add noise? |
Check whether the indicator explains risk references
Some analytical tools display volatility-based target or risk reference levels. These can help traders organize a chart review, but they should not be interpreted as guaranteed targets or recommended outcomes. A reference level is only one input in a broader decision process that includes position sizing, market conditions and personal risk limits.
When comparing the best trading indicators free with more feature-rich options, ask whether these levels are explained clearly. You should understand what the reference represents, which settings influence it, and whether it is based on a visible chart condition. If the tool presents levels without explanation, the extra visual information may not improve your analysis.
How to evaluate a free tool without overestimating it
A short, structured test is more useful than adding several indicators to a chart and judging them by appearance. Start with one or two markets and a defined observation period. Record what the tool displays, which alerts you receive, and whether the information helps you follow your own analysis process.
- Define your questions. Decide whether you mainly need trend context, momentum information, market structure, alerts or a combination.
- Review the documentation. Identify what each label, dashboard element and alert condition is intended to represent.
- Use a consistent chart layout. Avoid changing multiple settings at once, because that makes comparisons difficult.
- Check several timeframes. Note whether the tool remains clear when moving between broader and shorter-term charts.
- Review alerts alongside the chart. Ask whether the notification adds useful timing or simply repeats information already visible.
- Keep a neutral record. Write down both helpful and confusing features rather than judging the tool from a few memorable examples.
This process does not prove that an indicator will produce profitable results. It helps you determine whether the tool fits your research routine and whether its information is presented in a way you can use responsibly.
Where AKMelytics fits in a TradingView indicator comparison
AKMelytics – Smart Money Indicator is a TradingView technical analysis tool from VP ALGO TRADING. Its described feature set combines momentum, trend analysis, market structure, market flow, relative strength and smart money concepts. It also includes multi-timeframe analysis, BOS and CHoCH structure events, Fibonacci projections, volatility-based target and risk reference levels, dashboard context and configurable TradingView alerts.
That combination makes it relevant for readers comparing a basic free chart tool with an indicator that brings several analytical categories into one workspace. The right comparison is not whether every feature is needed. It is whether the available context is clear, relevant to your workflow and easy to evaluate without treating the indicator as financial advice.
VP ALGO TRADING offers a request-based 7-day free trial for its indicator and Telegram channel. Access details should be confirmed directly with the company because trial arrangements and product access requirements may change. After purchase, customers are instructed to provide their TradingView ID by email for access, and support is available for installation, activation or usage assistance.
Free indicator or broader analytical tool?
A free indicator may be the right choice when you are learning chart basics, testing a single concept or trying to keep your layout simple. It can also make it easier to understand whether you actually need additional features. A broader analytical tool may be worth evaluating when you want trend, momentum, structure and alert information organized in one place.
Neither option removes the need for independent judgment. An indicator can organize information, highlight conditions and support chart review, but it cannot guarantee a market outcome or eliminate trading losses. Treat every displayed signal, projection and alert as information to investigate rather than an instruction to act.
A practical checklist for choosing a TradingView trading indicator
- Does the tool match the type of analysis you already understand?
- Are its labels and concepts explained clearly?
- Can you identify the conditions that create an alert?
- Does it offer enough chart context to review a signal properly?
- Can you distinguish higher-timeframe information from lower-timeframe events?
- Are target or risk references presented as analytical aids rather than promises?
- Does the layout remain readable when several features are active?
- Can you test the tool through the access option that is actually available?
The best trading indicators free are not necessarily the ones with the most visible labels or the strongest promotional language. They are the tools that give you understandable information, fit your charting process and make it easier to review market conditions carefully. Comparing access, alert capabilities and analytical depth will help you make a more informed TradingView decision.
Frequently asked questions
What should I look for in the best trading indicators free?
Look for clear definitions, useful chart context, understandable alerts and features that match your analysis method. Free access alone does not indicate whether an indicator is suitable for your workflow.
Are free TradingView indicators reliable?
Reliability depends on how the tool is designed, explained and used. No indicator can guarantee profitable results or remove the need for independent analysis and risk management.
What is the difference between an alert and a trading signal?
An alert is a notification that a defined chart condition has occurred. It is not automatically a complete trading signal or a recommendation to enter or exit a position.
Why does market structure matter when comparing indicators?
Market structure provides context for price movement through events such as BOS and CHoCH. It can help organize chart analysis, but each event still needs to be considered with timeframe and broader market conditions.
Does AKMelytics – Smart Money Indicator offer a free trial?
VP ALGO TRADING states that it offers a request-based 7-day free trial for its indicator and Telegram channel. Current access details should be confirmed directly with the company.
Can a smart money indicator replace a trading plan?
No. A smart money indicator can support analysis of structure, flow and related conditions, but it does not replace a trading plan, risk controls or personal judgment.


Recent Comments