
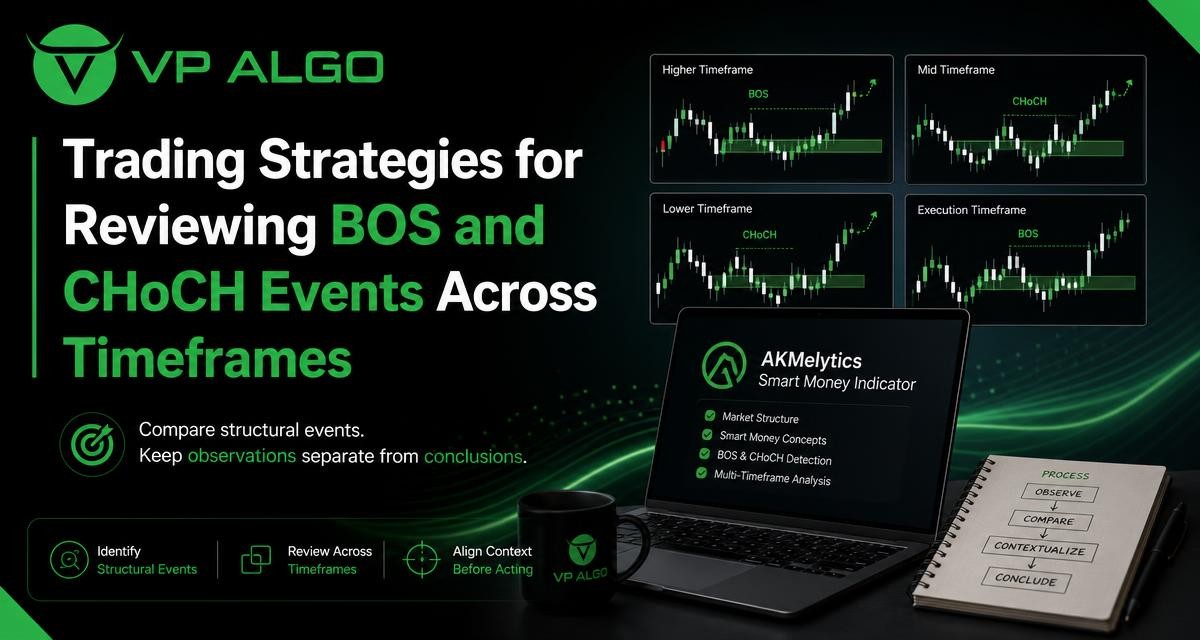
Trading strategies that use Break of Structure (BOS) and Change of Character (CHoCH) events can become more consistent when each chart timeframe is reviewed for a specific purpose. Instead of treating every structural label as an immediate trade signal, traders can first record what happened, compare the event with higher- and lower-timeframe context, and only then form a conclusion about a potential setup.
What BOS and CHoCH Events Represent
BOS and CHoCH are commonly used in market structure analysis to describe how price interacts with prior swing points. A BOS generally refers to price breaking a previous structural high or low in the direction of an existing move. A CHoCH is often used to describe a potential change in the character of that move, such as price breaking a meaningful swing against the prior trend.
These terms are useful because they give traders a vocabulary for describing price behaviour. They do not, by themselves, prove that a trend will continue or reverse. The quality of the swing points, the timeframe used, the strength of the break, and the surrounding market context all influence how an event should be interpreted.
| Event | Basic observation | Question for review |
|---|---|---|
| BOS in an upward structure | Price moves beyond a relevant prior high | Does the break support continuation, and was the prior structure clearly defined? |
| BOS in a downward structure | Price moves beyond a relevant prior low | Is selling pressure still aligned with the broader structure? |
| CHoCH after an upward move | Price breaks a meaningful swing low | Is this a genuine change in behaviour or a temporary pullback? |
| CHoCH after a downward move | Price breaks a meaningful swing high | Has price changed direction, or has it only retraced within the decline? |
Why Timeframe Context Matters
The same price movement can appear bullish on a short chart and bearish on a longer chart. A lower-timeframe BOS may represent a small continuation inside a larger downtrend. Similarly, a lower-timeframe CHoCH may be no more than a brief countertrend move before the higher-timeframe structure resumes.
Multi-timeframe analysis helps separate these possibilities. A higher timeframe can provide the broad structural setting, while an intermediate timeframe can show the active swing and a lower timeframe can help examine the detail of the move. This does not make the conclusion certain, but it reduces the risk of assigning the same importance to every event.
A practical three-layer review
- Higher timeframe: Identify the broad directional structure and the most relevant major swing points.
- Decision timeframe: Review the current leg, recent BOS or CHoCH events, and the area where a potential setup is being considered.
- Lower timeframe: Examine how price is behaving around the area, without allowing minor fluctuations to replace the broader context.
The exact chart intervals can vary according to the trader’s process. The important principle is consistency: use the same role for each timeframe during review so that the analysis does not change simply because the chart has been switched.
Separate Observations From Conclusions
The central discipline in reviewing structural events is to keep facts and interpretations apart. An observation describes what is visible on the chart. A conclusion explains what the observation might mean for a trading plan. Mixing the two too early can make a trader treat an assumption as if it were confirmed evidence.
Examples of observations
- Price broke above a previously identified swing high on the selected timeframe.
- The break occurred after a period of declining or sideways movement.
- The higher timeframe still shows a sequence of lower highs and lower lows.
- The lower timeframe produced several small breaks in both directions.
- The event occurred near a previously marked area of interest.
Examples of conclusions
- The move may support continuation of the current directional structure.
- The event may indicate a possible transition, but confirmation is still limited.
- The lower-timeframe movement may be noise within the higher-timeframe trend.
- The chart may offer a setup to study, but not a reason to enter without further rules.
A simple worksheet can make this separation visible. Write the event and its location first. Only after recording those details should you assess whether the event agrees with the broader structure, conflicts with it, or remains unclear.
A Step-by-Step Process for Reviewing BOS and CHoCH
1. Define the chart roles before looking for an entry
Decide which chart will represent the broad context, which will represent the working structure, and which will be used for detailed observation. This prevents a common mistake: selecting a timeframe after seeing an attractive event and then presenting that event as more significant than it may be.
Each chart should answer a different question. The higher timeframe asks where the market has been moving. The working timeframe asks what the current structural leg is doing. The lower timeframe asks how price is behaving at a specific point, not whether it should override the larger picture.
2. Mark meaningful swing points
BOS and CHoCH labels depend on the swing points being used. Mark highs and lows that are clear enough to support the review, rather than every small fluctuation. If the chart contains many competing labels, reduce the analysis to the swings relevant to the timeframe’s role.
A meaningful swing is not defined only by its appearance on one candle. It should be considered in relation to the surrounding price action and the degree to which it shaped the current move. A structure break through a minor intraday fluctuation may deserve less weight than a break through a swing that preceded a substantial directional leg.
3. Record the event without forecasting
When a BOS or CHoCH appears, record the timeframe, direction, broken swing, and approximate location. Note whether the move was sharp, gradual, or accompanied by extended consolidation. At this stage, avoid describing the event as a guaranteed reversal or continuation.
This step is particularly useful when using a market structure indicator. An indicator can make events easier to see and can provide a consistent visual reference, but the label still needs to be examined in the context of the chart. The goal is to use the tool to organise analysis, not to replace the review itself.
4. Compare the event with the higher timeframe
Next, ask whether the event agrees with the broader structure. A bullish BOS on the working timeframe may align with a higher-timeframe upward structure, conflict with a higher-timeframe decline, or occur while the higher timeframe is range-bound. These are different situations and should not receive the same conclusion.
| Working-timeframe event | Higher-timeframe context | Reasonable review language |
|---|---|---|
| Bullish BOS | Bullish structure | Continuation is structurally aligned; assess location and risk rules separately. |
| Bullish BOS | Bearish structure | Countertrend movement or transition is possible; avoid treating alignment as confirmed. |
| Bearish CHoCH | Bullish structure | Potential weakness or pullback; more evidence may be needed before calling a reversal. |
| Mixed BOS and CHoCH events | Range or unclear structure | Conditions are ambiguous; prioritise observation over forced directional conclusions. |
5. Inspect the lower-timeframe behaviour
The lower timeframe can reveal whether price is moving cleanly, repeatedly changing direction, or forming a short-term structure around the area under review. It can also show why a higher-timeframe event may look different when examined more closely.
However, lower-timeframe detail can create excessive noise. If every small break is treated as a new thesis, the analysis may become reactive. Use the lower chart to refine an already defined question, not to search indefinitely for a more convenient interpretation.
6. Form a conditional conclusion
A useful conclusion describes what would support or weaken the interpretation. For example, a trader might record that a working-timeframe bullish BOS is aligned with the higher timeframe, but that continuation still depends on the price holding a defined area and meeting the trader’s independent risk criteria. This is more disciplined than writing that the market must continue upward.
Conditional language also makes later review easier. If the outcome differs from the original expectation, the trader can determine whether the observation was inaccurate, the interpretation was too strong, or the market simply did not follow the scenario.

How a Market Structure Indicator Can Support the Process
A market structure indicator can help traders organise BOS and CHoCH observations across chart views. AKMelytics – Smart Money Indicator is described as a TradingView technical analysis tool with features related to market structure, momentum, trend analysis, market flow, relative strength and smart money concepts. Its listed functionality includes multi-timeframe analysis, BOS and CHoCH events, Fibonacci projections, volatility-based target and risk reference levels, dashboard context and configurable TradingView alerts.
These features can support a review workflow by bringing several types of chart context into one analytical environment. For example, a trader may use the structure events to identify what changed, the multi-timeframe view to compare context, and the dashboard to organise related observations. The indicator should still be treated as an aid for analysis and decision-making rather than as financial advice or a guarantee of a particular result.
Questions to ask when using an indicator
- What swing point does the displayed BOS or CHoCH appear to reference?
- Is the event visible on the timeframe that matters to the current plan?
- Does the higher-timeframe context agree, conflict, or remain neutral?
- Are multiple signals describing the same event, or are they independent observations?
- What rules will determine whether the event is actionable?
Configurable alerts can help with monitoring, but an alert is only a notification that a defined condition may have occurred. It is not a substitute for checking the chart, reviewing the surrounding structure, and applying a risk process.
Common Errors in Multi-Timeframe Structure Analysis
Giving every CHoCH the same importance
A CHoCH on a small chart may reflect a brief retracement, while a break of a major higher-timeframe swing may represent a more meaningful structural change. The label alone does not establish the importance of the event. Its timeframe and the swing being broken must be considered together.
Using lower-timeframe signals to override context
Lower-timeframe detail can be valuable, but it can also encourage premature decisions. If the higher timeframe is clearly directional, a series of short-lived countertrend breaks may not justify abandoning the broader assessment.
Confusing a price break with confirmation
A break can be observed without being treated as confirmation of a complete trading thesis. Traders may need additional rules concerning location, invalidation, volatility, position sizing and trade management. Those rules are separate from the act of identifying BOS or CHoCH.
Forcing a conclusion in an unclear market
Mixed structure is still information. When charts show repeated breaks in both directions or lack clear swing definition, the most accurate conclusion may be that the market is ambiguous. Waiting for a clearer structure can be part of a sound review process rather than a failure to find a trade.
Building a Repeatable Review Journal
A journal turns a visual chart review into a process that can be examined later. Keep the record concise enough to complete consistently, but detailed enough to distinguish the event from the conclusion.
| Journal field | What to record |
|---|---|
| Date and chart view | The review date and the timeframes used for context, decision-making and detail. |
| Structural event | BOS or CHoCH, direction, and the swing point involved. |
| Higher-timeframe state | Broad bullish, bearish, range-bound or unclear structure. |
| Lower-timeframe behaviour | Continuation, retracement, consolidation or conflicting movement. |
| Observation | What the chart visibly showed before interpretation. |
| Conclusion | The conditional scenario considered and what could invalidate it. |
| Review outcome | Whether the original observation and conclusion remained consistent after later price action. |
Over time, this type of journal can reveal whether mistakes come from misidentifying swings, switching timeframes too often, interpreting countertrend movement too aggressively, or failing to define invalidation. It does not turn historical review into a promise about future performance. Its purpose is to improve clarity and consistency in the analytical process.
Risk Awareness When Applying These Trading Strategies
BOS and CHoCH analysis is one component of technical review, not a complete risk framework. A structural event can fail, occur late, or be interpreted differently by different traders. Any trading plan should account for the possibility that the expected continuation or reversal does not develop.
Before acting on a structural scenario, consider whether the plan defines the conditions that would invalidate the idea, how much exposure is acceptable, and how the position would be managed if price behaves differently. An indicator’s target or risk reference level may help organise the chart, but it should not be treated as a guarantee or as personalised financial guidance.
VP ALGO TRADING positions its indicators as tools for educational and trading-decision assistance. Traders remain responsible for evaluating whether a method suits their own objectives, experience and risk tolerance. A structured review can improve the quality of a decision without removing uncertainty from the market.
Frequently Asked Questions
What is the difference between BOS and CHoCH?
BOS generally describes a break that supports the existing directional structure, while CHoCH describes a break that may signal a change in market behaviour. The exact interpretation depends on the swing points and timeframe used.
Why should BOS and CHoCH be reviewed across multiple timeframes?
Different timeframes show different levels of structure. A lower-timeframe event may be a small movement inside a larger trend, so comparing chart views helps place the event in context.
Does a CHoCH confirm a trend reversal?
No. A CHoCH can indicate a possible transition, but it may also represent a temporary pullback. Additional context and clearly defined trading rules are needed before forming a stronger conclusion.
How can a market structure indicator help with this analysis?
It can help display BOS and CHoCH events, organise multi-timeframe context and bring related observations into one TradingView workspace. The displayed information still requires independent review.
Should lower-timeframe structure override higher-timeframe structure?
Not automatically. Lower-timeframe structure can refine an analysis, but it should not replace the broader context without a defined reason and supporting evidence.
What should be recorded in a BOS and CHoCH journal?
Record the timeframe, event type, broken swing, higher-timeframe context, lower-timeframe behaviour, objective observation and conditional conclusion. Reviewing these records can expose repeated analytical errors.
Are BOS and CHoCH trading strategies financial advice?
No. They are analytical concepts used to study price structure. Tools such as AKMelytics – Smart Money Indicator are intended to support analysis and decision-making, not provide financial advice or guarantee results.


Recent Comments