
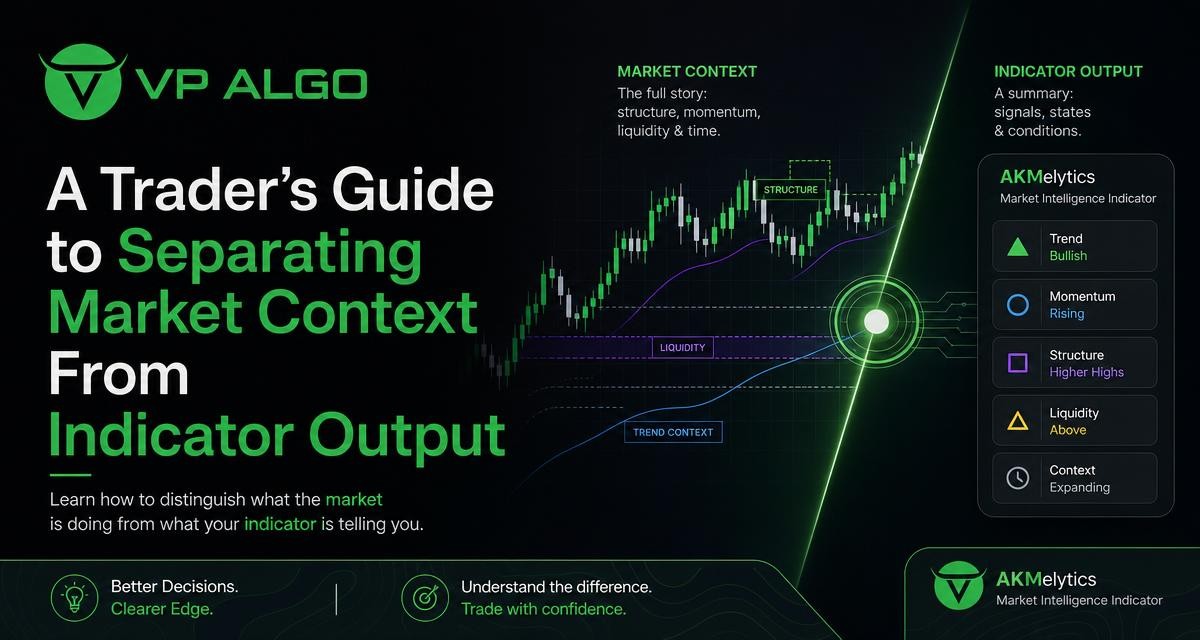
A TradingView trading indicator can make a chart easier to review, but it does not replace the market conditions visible in price action. The most useful analysis begins with context: trend, structure, momentum, volatility and the location of price. Indicator output should then be treated as a structured summary of selected information, not as an independent explanation of why the market is moving.
What market context means
Market context is the broader condition in which a price movement is taking place. It includes the direction of the larger trend, the sequence of swing highs and lows, the strength or weakness of momentum, and whether price is moving through a range, reacting from a level or extending an existing move.
Context also includes timeframe. A chart may show a short-term rally while the higher-timeframe structure remains sideways or bearish. Neither observation is automatically wrong. They describe different parts of the same market. A review becomes more useful when the trader identifies which timeframe is being used for context and which one is being used to study a possible setup.
The main questions to ask before looking at signals
- Is price trending, ranging or transitioning between conditions?
- Are swing highs and lows being formed in a consistent direction?
- Is momentum supporting the current movement or weakening?
- Where is price positioned within the recent range or structure?
- Is the current move an expansion, a pullback or a reaction from a previous area?
- Does the selected timeframe agree with the broader chart context?
These questions do not produce a guaranteed forecast. They create a description of the chart that can be tested against the next price movement. That distinction matters because analysis is about organizing evidence, while prediction attempts to assign certainty to an uncertain outcome.
What indicator output represents
An indicator processes price or other chart data according to defined calculations and displays the result in a visual form. Depending on its design, it may summarize trend, momentum, market structure, institutional activity or other aspects of a chart. A label, line, zone or color change is therefore an output of a method, not a direct view into the future.
Even a sophisticated TradingView trading indicator is selective. It may emphasize a particular type of evidence while giving less attention to information outside its design. This is why two indicators can show different outputs on the same chart without one necessarily being defective. They may be measuring different conditions, using different sensitivity settings or interpreting the same price sequence in different ways.
| Chart element | What it describes | Useful review question |
|---|---|---|
| Price structure | The sequence and location of swing highs and lows | Is the market making higher, lower or mixed swings? |
| Trend output | A summarized view of directional movement | Does the output agree with the visible structure? |
| Momentum output | The strength or speed of recent movement | Is momentum confirming the move or losing force? |
| Market structure output | Potential changes or continuations in structural behavior | What price event caused the change in the display? |
| Activity or flow output | A model-based representation of selected participation conditions | Does this information fit the price location and trend? |
The table illustrates the difference between an observation and an interpretation. “Price has moved above a recent swing” is an observation. “The market must continue higher” is an interpretation. Indicator output can help organize observations, but the interpretation still requires a review of context and risk.
Why context should come before the indicator
Starting with a signal can encourage a trader to search for reasons to accept it. Starting with context creates a more neutral process. First, the trader describes the chart. Next, the indicator is checked to see whether its output supports, qualifies or conflicts with that description.
This order also helps with conflicting signals. For example, a momentum display may turn positive during a short rally, while the broader market remains inside a range. The output may be accurately describing recent momentum, but it does not necessarily establish a new trend. Without context, the same color change can appear more significant than it is.
A practical sequence for chart review
- Start with the higher timeframe. Identify whether the broader condition is directional, ranging or unclear.
- Mark the visible structure. Note important swing points, breaks, failed breaks and areas where price repeatedly reacted.
- Assess current location. Determine whether price is near the middle of a range, an established boundary or a recent structural point.
- Review momentum. Ask whether the current movement is expanding, slowing or showing disagreement with price.
- Read the indicator output. Record what it is displaying without immediately treating it as a trade instruction.
- Compare the two views. Decide whether the output confirms the context, adds detail or conflicts with it.
- Define invalidation. Identify the chart condition that would make the original interpretation less useful.
This sequence is deliberately cautious. It does not require a trader to ignore indicators. It places them in a process where their output can be questioned and compared with the underlying chart.
Separating structure from structure labels
A market structure indicator may mark swing points, breaks or changes in directional behavior. Such labels can make a complex chart easier to scan, especially when the trader is reviewing several timeframes. However, the label is a summary of a rule applied to price. The trader should still inspect the candles and levels that produced it.
Ask what the label actually identifies. Does it refer to a break of a meaningful swing, a short-term fluctuation or a threshold defined by the indicator? What happened immediately before the event? Was price expanding with clear follow-through, or did it briefly move beyond a level and return? These questions help prevent a structural label from being read without its surrounding evidence.
Three useful checks for structure output
- Scale: Compare the marked structure with the timeframe and the size of the move being analyzed.
- Location: Consider whether the event occurred at a meaningful area or in the middle of a congested range.
- Follow-through: Observe whether later price action supports the change or returns to the prior condition.
A structure display is most useful when it improves consistency in the review. It should help the trader ask better questions, not remove the need to answer them.
Using trend and momentum without confusing them
Trend and momentum are related but different. Trend describes the direction and organization of price movement over a chosen period. Momentum describes the strength or rate of recent movement. A market can have an established upward trend while short-term momentum is declining during a pullback. It can also show strong short-term momentum inside a broader range.
When a TradingView trading indicator combines or displays trend and momentum information, read each component on its own before forming a combined view. A trend output may remain positive while momentum weakens. That does not automatically invalidate the trend, but it may indicate that the current movement deserves closer review rather than immediate acceptance.
| Situation | Possible reading | What to examine next |
|---|---|---|
| Trend and momentum agree | Directional conditions are aligned on the selected timeframe | Structure, price location and possible invalidation |
| Trend positive, momentum weakening | The broader move may still exist while short-term force fades | Pullback depth, support and subsequent price response |
| Trend unclear, momentum strong | A sharp move may be developing inside a transition or range | Whether structure confirms continuation or rejects the move |
| Trend and momentum disagree | The chart may require a slower, more selective review | Timeframe alignment and the reason for the disagreement |
This framework avoids assigning a fixed meaning to a single display. The same indicator output can carry different importance depending on where it appears and what the underlying chart is doing.

How smart money and activity concepts fit into context
Smart money concepts and institutional activity displays are often used to organize ideas about participation, liquidity and areas of interest. These concepts can add another layer to a chart review, but they should not be treated as proof that a particular group is taking a specific action. A plotted area or activity signal remains an interpretation produced by the tool.
Use these outputs alongside price structure. If an activity-related display appears near a structural level, ask whether price reacts there and whether the reaction changes the chart condition. If it appears in the middle of a broad range, its practical meaning may be less clear. Context gives the output a setting; the output may then help the trader focus attention on a particular part of that setting.
Building a repeatable indicator review
A repeatable review does not need to be complicated. It needs consistent questions and a clear separation between what is visible, what the indicator summarizes and what the trader concludes. Writing down the answers can expose when a decision is being driven mainly by a prominent label rather than by the entire chart.
A simple review template
- Market condition: Trend, range, transition or unclear.
- Higher-timeframe view: The broader directional or structural description.
- Current location: The relevant range, swing area or reaction zone.
- Price behavior: Expansion, pullback, rejection, consolidation or mixed movement.
- Indicator output: The specific trend, momentum, structure or activity information displayed.
- Agreement or conflict: Whether the output supports the context or highlights uncertainty.
- Invalidation: The price behavior that would weaken the interpretation.
Reviewing charts this way can also make indicator selection more disciplined. Instead of asking which tool gives the strongest signal, ask which tool helps answer a specific question. One indicator may be useful for trend assessment, another for momentum and another for organizing market structure. More displays do not automatically create better analysis; they can also create duplicated information and confusion.
Using a TradingView trading indicator responsibly
Indicators are decision-support tools, not substitutes for judgment or risk management. A display may lag, change as new candles form or produce an output that is difficult to interpret in a different market condition. The trader should understand what the tool is designed to summarize and how its output fits the chosen review process.
VP ALGO TRADING develops trading indicators and algorithmic trading tools for TradingView, including the AKMelytics – Market Intelligence Indicator. Traders evaluating this type of tool should focus on whether its market intelligence features fit their own chart-review process. The relevant question is not whether an indicator can remove uncertainty, but whether it helps the user organize trend, momentum, structure and related market observations more consistently.
Any review of an indicator should remain educational and practical. Past chart behavior does not guarantee future results, and no indicator eliminates the possibility of losses. A trader remains responsible for understanding the tool, defining personal risk limits and making independent decisions.
Common mistakes when reading indicator output
Treating every color change as a new trend
A color change may reflect a short-term calculation rather than a complete structural shift. Check the swing points, timeframe and follow-through before giving it greater meaning.
Using too many indicators that measure the same thing
Several trend displays may appear to confirm one another while simply processing similar price information. A smaller set of clearly understood tools can make the review easier to audit.
Ignoring the location of the signal
The same output can matter differently near a range boundary, after a strong expansion or in the middle of congestion. Location often determines whether an observation is notable or routine.
Confusing explanation with prediction
An indicator can summarize what has happened and help describe current conditions. That does not mean it can establish what must happen next. Keep the language of the review conditional and tied to observable chart behavior.
Final checklist for separating context from output
- Describe the market before reading the indicator.
- Identify the timeframe behind each observation.
- Separate price structure from the label applied to it.
- Read trend and momentum as related but distinct conditions.
- Check where the output appears on the chart.
- Look for follow-through rather than assuming confirmation.
- Record conflicts instead of forcing agreement.
- Define what would weaken the interpretation.
- Use the indicator to organize review, not to promise an outcome.
The clearest chart reviews connect three layers: what price is doing, what the indicator is summarizing and how the trader is interpreting both. A TradingView trading indicator can support that process when its output is examined in context. Used this way, it becomes part of a structured method for reviewing market conditions rather than a replacement for analysis.
Frequently asked questions
What is the difference between market context and indicator output?
Market context is the broader description of price conditions, including trend, structure, momentum and location. Indicator output is a calculated summary of selected chart information. The output should be interpreted within the context rather than treated as the context itself.
Can a TradingView trading indicator identify the future direction of price?
No indicator can establish a guaranteed future direction. It can organize information about current or recent conditions, but markets remain uncertain and the output may not lead to the expected result.
How should I use a market structure indicator?
Use it to help locate swing points, possible structural changes or areas requiring review. Then inspect the underlying price action, timeframe, location and follow-through before forming an interpretation.
Why can an indicator disagree with what I see on the chart?
The indicator may use different rules, sensitivity or timeframes from your visual assessment. The disagreement may also show that trend, momentum and structure are describing different parts of the same market condition.
Should trend or momentum receive more weight?
Neither always deserves priority. Trend describes directional organization, while momentum describes recent force. Their relationship, along with price location and structure, provides a more useful review than either measure alone.
Can the AKMelytics – Market Intelligence Indicator replace chart analysis?
No. It should be considered a tool for organizing market information and supporting a trader’s review. Users still need to assess price action, understand the indicator’s output and make independent decisions.
What is the best way to test an indicator in a review process?
Use consistent questions across a sample of charts, record the context and the indicator output separately, and note where they agree or conflict. This helps you understand how the tool behaves without assuming guaranteed results.


Recent Comments