
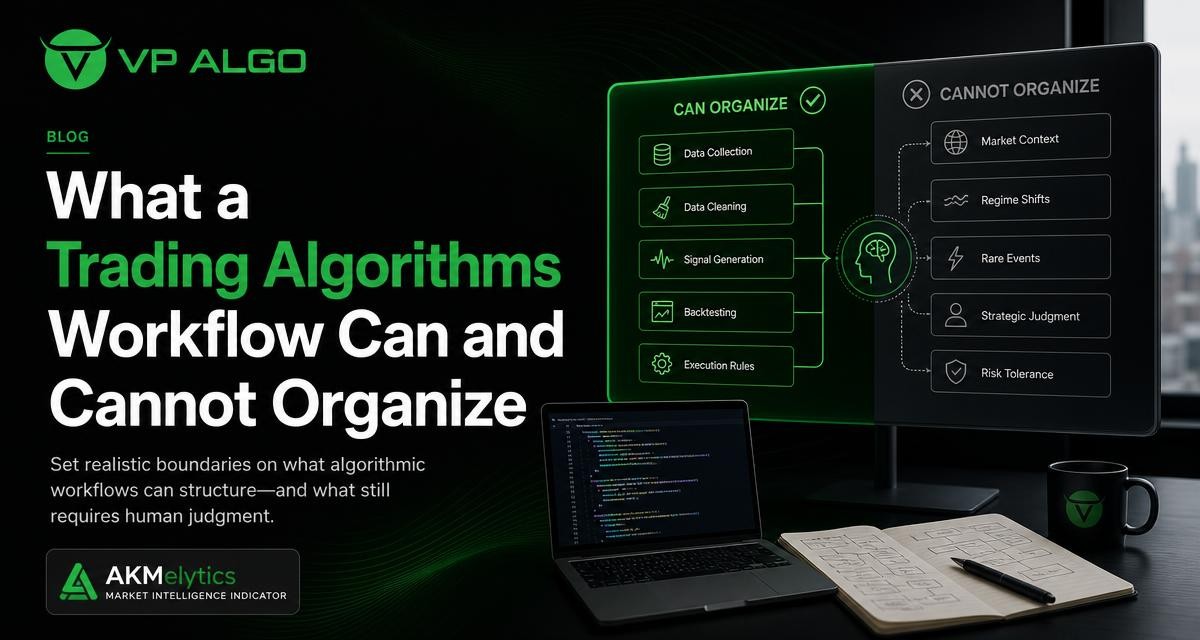
Trading algorithms can make chart analysis more structured by organizing information about trend, momentum, market structure, institutional activity, and smart money conditions. They cannot, however, turn uncertain market information into a guaranteed decision. A useful workflow treats algorithm-assisted observations as inputs for analysis rather than as a substitute for interpretation, discipline, or risk awareness.
What a trading algorithms workflow actually means
The phrase trading algorithms can describe several different types of tools. Some algorithms execute orders automatically. Others process price data and display conditions on a chart. An indicator-based workflow belongs mainly to the second category: it helps arrange observations so that a trader can examine a market in a more consistent sequence.
For example, a TradingView indicator may bring several analytical themes into one workspace. Instead of switching between unrelated charts or relying on memory, a trader can review trend direction, momentum behavior, market structure, institutional activity, and smart money concepts as connected parts of the same process. The purpose is not to remove uncertainty. It is to reduce disorganization when reviewing a possible setup.
Organization is different from automation
An algorithm can apply programmed rules to available market data. It may identify a change in a calculated condition, highlight a structural event, or display information across more than one timeframe. That is different from understanding why the market is moving or deciding whether a particular observation deserves action.
This distinction matters because the word “algorithmic” can create unrealistic expectations. A chart tool may organize analysis without being a trading bot, broker, investment manager, or source of financial advice. Traders still need to define their own process and decide how much weight to give any indicator output.
What trading algorithms can organize
1. Trend observations
One of the most useful roles for an algorithm-assisted workflow is to organize trend information. Trend analysis asks whether price is generally moving upward, downward, or without a clear directional bias over the timeframe being studied. A trend-related display can help place this question near the beginning of the review process.
Organizing trend observations does not mean that a market must continue in the same direction. It simply gives the trader a starting point for considering whether a potential setup is aligned with, counter to, or independent of the broader directional condition. Reviewing multiple timeframes can also show whether a short-term movement is occurring within a larger trend or against it.
2. Momentum conditions
Momentum evaluation adds another layer to chart organization. Price direction alone may not describe how strongly a move is developing. A momentum signal can help a trader ask whether movement is gaining strength, losing force, or behaving differently from the recent price action.
These observations are most useful when treated as context rather than a simple instruction to buy or sell. Momentum can change quickly, and a strong move can continue longer than expected or reverse without providing a clean explanation. An algorithm can highlight a condition; the trader must determine how relevant that condition is to the market and timeframe under review.
3. Market structure
Market structure refers to the way price develops sequences of highs, lows, breaks, and changes in direction. A market structure indicator can help organize these events so that the trader is not relying only on a quick visual impression of a candlestick chart.
Structure-based observations may be useful for framing questions such as whether a recent movement confirms an existing directional idea, challenges it, or creates a less certain environment. The algorithm can mark or summarize a structural condition, but the meaning of that condition depends on scale, timeframe, volatility, and the surrounding price action.
4. Institutional activity and smart money concepts
Some trading indicators are designed to organize observations associated with institutional activity and smart money concepts. These may be used alongside trend, momentum, and market structure analysis to create a broader view of market conditions.
Such labels should be interpreted carefully. A display associated with institutional flow is not direct proof of what a particular institution has done, nor does it reveal the intentions of every market participant. It is an analytical representation based on the information and rules available to the tool. Human review remains necessary before assigning meaning to the signal.
5. Multi-timeframe comparisons
Markets can look different depending on the timeframe. A short-term chart may show a pullback while a higher timeframe still reflects an upward trend. Conversely, a short-lived rise may occur inside a broader decline. A workflow that organizes multi-timeframe trend assessment helps make these differences visible.
The benefit is consistency. A trader can compare timeframes using a repeatable sequence rather than choosing whichever chart supports an initial opinion. This does not make timeframes agree, and disagreement is itself useful information. It may indicate that the market requires more caution or that the setup does not fit the trader’s defined process.
A practical workflow for using an indicator
A structured review can be simple enough to repeat while still leaving room for judgment. The following sequence is an example of how a trader might use a TradingView indicator to organize observations without treating the tool as an automatic decision-maker.
- Define the chart and timeframe. Be clear about the market view being examined and avoid changing timeframes merely to obtain a more attractive signal.
- Review the broader trend. Ask whether the higher-level condition appears directional, mixed, or unclear.
- Examine market structure. Consider recent highs, lows, breaks, and possible changes in the previous pattern.
- Check momentum. Look for evidence that the current movement is strengthening, weakening, or lacking clear follow-through.
- Consider smart money and institutional activity observations. Treat these as additional context rather than standalone confirmation.
- Compare timeframes. Identify whether the shorter-term picture supports, challenges, or is unrelated to the broader view.
- Write down the uncertainty. If important observations conflict, record the conflict instead of forcing a directional conclusion.
- Apply a personal decision and risk process. The indicator can organize information, but the trader remains responsible for evaluating whether the setup fits their own rules.
| Workflow stage | What an algorithm may organize | What still requires human review |
|---|---|---|
| Trend | Directional conditions across selected timeframes | Whether the trend is relevant to the planned analysis |
| Momentum | Changes in calculated momentum conditions | Whether momentum has enough context to matter |
| Market structure | Potential breaks, sequences, or structural shifts | The significance of those events at different scales |
| Institutional activity | Displayed observations associated with flow or smart money concepts | Whether the interpretation is justified by the broader chart |
| Multi-timeframe review | A more organized comparison of timeframe conditions | How to respond when timeframes disagree |
| Decision process | Consistent presentation of relevant observations | Judgment, risk awareness, and final responsibility |
What trading algorithms cannot organize for you
Market context outside the chart
A chart-based algorithm works with the data and rules available to it. It does not automatically provide a complete explanation for news, changing market conditions, liquidity differences, or unexpected events. Even when a display looks clear, the wider context may be incomplete.
This is why an indicator should not be treated as a complete market model. A clean visual layout can improve focus, but it cannot guarantee that every factor affecting price has been captured or interpreted correctly.
Your personal objectives and constraints
No indicator can decide whether a particular market, timeframe, or setup is suitable for an individual trader. A tool does not know a user’s experience, available time, tolerance for uncertainty, financial circumstances, or personal rules.
Those questions sit outside the algorithm’s role. Before using any chart information, a trader should understand their own process and avoid treating a displayed condition as personalized financial guidance.
The quality of your interpretation
An organized chart can still be misunderstood. Traders may focus on one prominent signal, ignore conflicting evidence, or interpret a normal fluctuation as a major structural change. These are judgment errors, not problems that a visual indicator can always prevent.
A useful safeguard is to describe the observation in plain language before deciding what it means. For example, “short-term momentum is improving while the higher timeframe remains unclear” is more informative than simply calling a chart bullish.
Future outcomes
Trading algorithms organize current or historical observations; they do not know the future. No indicator can guarantee profitable results, eliminate losses, or establish that a past signal will lead to the same result later. Market conditions can change, and the same pattern may behave differently in a different environment.
For that reason, algorithm-assisted analysis should remain part of a broader decision process. The tool may help identify what to examine, but it cannot remove the uncertainty inherent in trading.
Common mistakes when using algorithmic trading solutions
Confusing more signals with better analysis
Adding more labels, lines, and alerts can make a chart harder to read. A workflow is useful only when each element answers a meaningful question. If several displays repeat the same information, the trader may gain visual complexity without gaining better understanding.
A practical approach is to assign each feature a specific role. Trend analysis can describe direction, market structure can describe price organization, momentum can describe force, and smart money observations can provide another context layer. If a feature does not change the question being asked, it may not belong in the review.
Treating a signal as a command
A signal can be an invitation to investigate, not an instruction to act. When traders treat every highlighted condition as a command, they risk ignoring timeframe conflicts, unclear structure, and changing conditions.
Instead, ask what the signal confirms, what it contradicts, and what information is missing. This keeps the indicator in its proper role: a tool for organizing analysis rather than a replacement for analysis.
Ignoring neutral conditions
Not every chart offers a clear directional opportunity. A useful workflow should be able to show uncertainty, mixed conditions, or a lack of confirmation. Forcing every observation into a bullish or bearish conclusion can make the process less reliable.
Neutrality is not a failure of the tool. It may be an accurate description of a market that does not currently present a clear alignment among trend, momentum, and structure.
Changing rules after seeing the chart
It is easy to create a new explanation after a movement has already occurred. A more disciplined process defines the questions in advance and records what would count as confirmation or contradiction. This makes it easier to distinguish a repeatable workflow from a story built around hindsight.
How to evaluate an indicator workflow
The right question is not whether an indicator can predict every market move. A more useful question is whether it helps you perform a clearer, more consistent review. Consider the following criteria:
- Clarity: Can you understand what each display is intended to represent?
- Relevance: Does the information relate to the market and timeframe you are studying?
- Consistency: Can you follow the same review sequence across different charts?
- Context: Does the workflow encourage you to examine trend, momentum, and structure together?
- Uncertainty: Can you recognize mixed or incomplete conditions rather than forcing a conclusion?
- Responsibility: Does the tool remain separate from claims of guaranteed results or personalized advice?
VP ALGO TRADING develops TradingView indicators and algorithmic trading tools intended to assist with this type of structured market review. Its identified indicator offering includes features related to trend analysis, momentum signals, market structure, institutional flow monitoring, multi-timeframe trend assessment, and smart money analysis. These features can help organize a chart, while interpretation and decision-making remain with the trader.
Using the workflow responsibly
Responsible use begins with realistic expectations. A trading indicator is not a broker, investment manager, or financial adviser. It does not remove the need to understand the chart, define a personal process, or recognize that losses and uncertainty remain possible.
It is also sensible to learn how the indicator presents its observations before relying on it in a live decision process. Review the available information, understand what each feature is designed to show, and use support for installation, activation, or usage questions when needed. A request-based free trial may also be available through the company, subject to the conditions provided by the business.
The strongest workflow is usually the one that improves questions rather than promising certainty. If an indicator helps you compare timeframes, notice structural changes, review momentum, and document conflicting evidence, it may make analysis more organized. The final interpretation still requires patience, skepticism, and personal responsibility.
Frequently asked questions
What are trading algorithms used for in chart analysis?
They can process market data and organize observations such as trend, momentum, market structure, institutional activity, and smart money conditions. Their output is an analytical aid, not a guarantee of a future result.
Are trading algorithms the same as a trading bot?
No. Some algorithms execute trades automatically, while others are indicators that display or organize chart information. An indicator-based workflow does not automatically mean that trades are being placed.
Can an algorithmic trading solution replace technical analysis?
No. It can support technical analysis by arranging relevant observations, but the trader still needs to interpret price action, assess context, and decide whether the information fits their own process.
Can a smart money indicator prove what institutions are doing?
No. A smart money or institutional flow display represents observations produced by the tool’s data and rules. It should not be treated as direct proof of the actions or intentions of every institution.
Why should traders compare multiple timeframes?
Different timeframes can show different conditions. Comparing them may reveal whether a short-term movement aligns with, conflicts with, or sits within a broader trend, although the trader must still interpret the differences.
Do trading algorithms guarantee profitable results?
No. Trading algorithms cannot guarantee profits, eliminate losses, or predict future market behavior. They organize information, while outcomes remain uncertain and decisions require independent judgment.
What is the best way to use a TradingView indicator?
Use it as part of a repeatable review process. Define the timeframe, examine trend and structure, review momentum and other context, note uncertainty, and apply your own decision and risk rules rather than treating a signal as an automatic command.


Recent Comments