
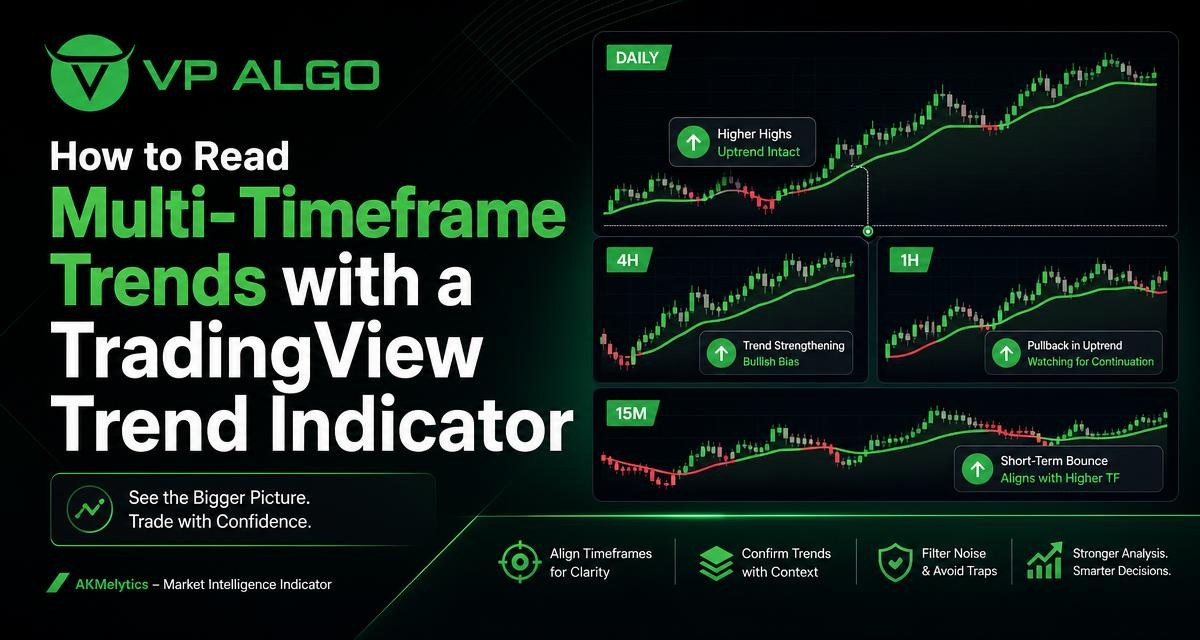
Learn how to compare higher-, intermediate-, and lower-timeframe trends in TradingView so you can interpret market structure and momentum with greater context.
VP ALGO TRADING > Blog > Trading Indicators
Learn how to compare higher-, intermediate-, and lower-timeframe trends in TradingView so you can interpret market structure and momentum with greater context.
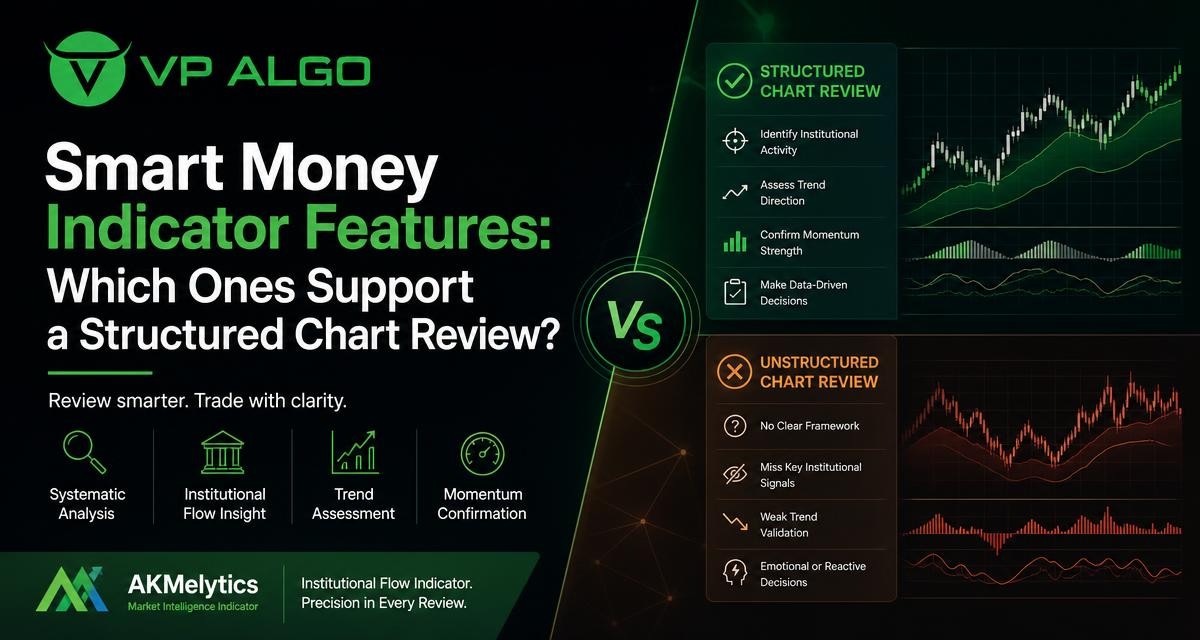
Learn how smart money analysis, market structure, trend assessment, momentum and institutional activity can fit into a more structured TradingView chart review.
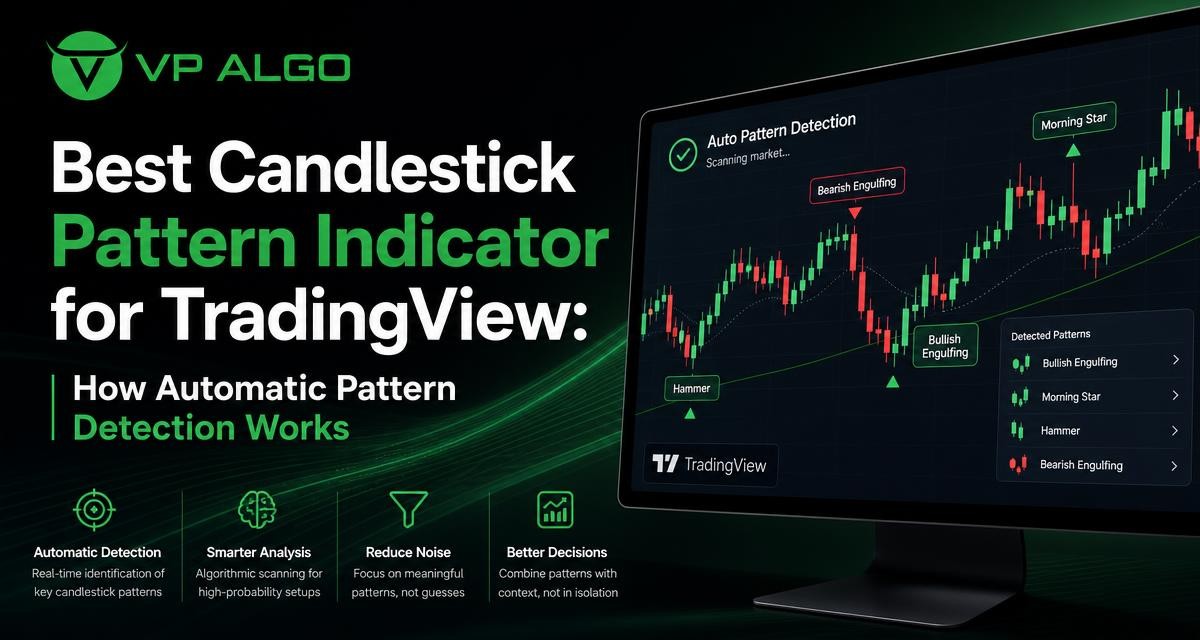
Learn how a candlestick pattern indicator for TradingView identifies chart formations, what its labels mean, and how to evaluate patterns with trend, momentum, and market structure.
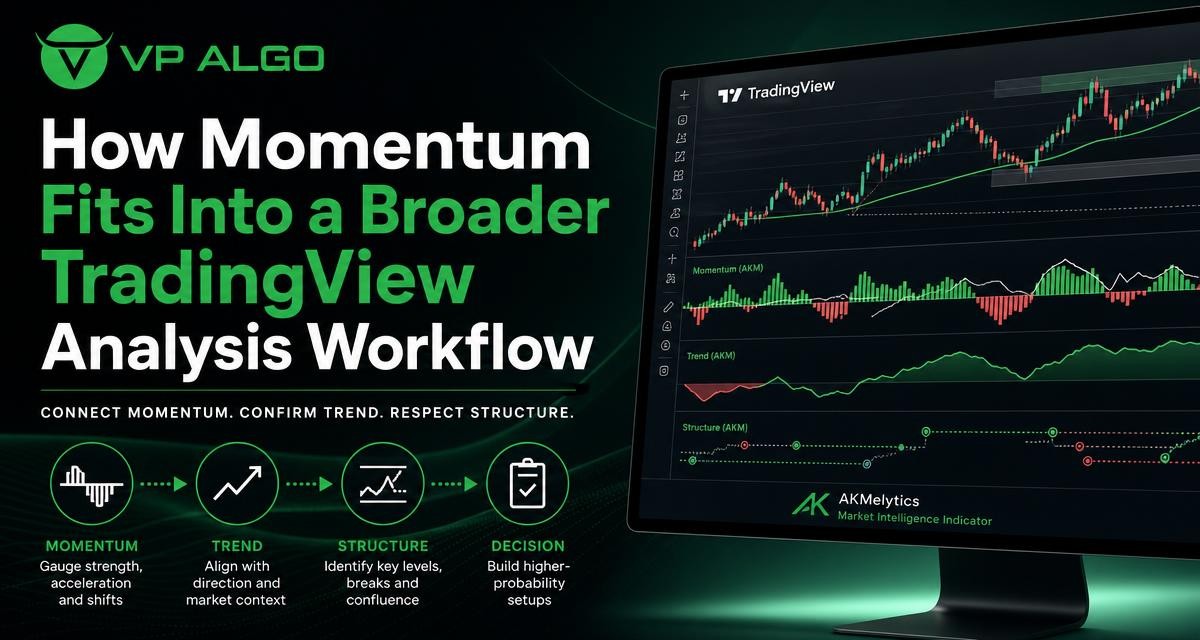
Learn how to use a momentum indicator for TradingView alongside trend, market structure, and multi-timeframe context instead of reading momentum in isolation.
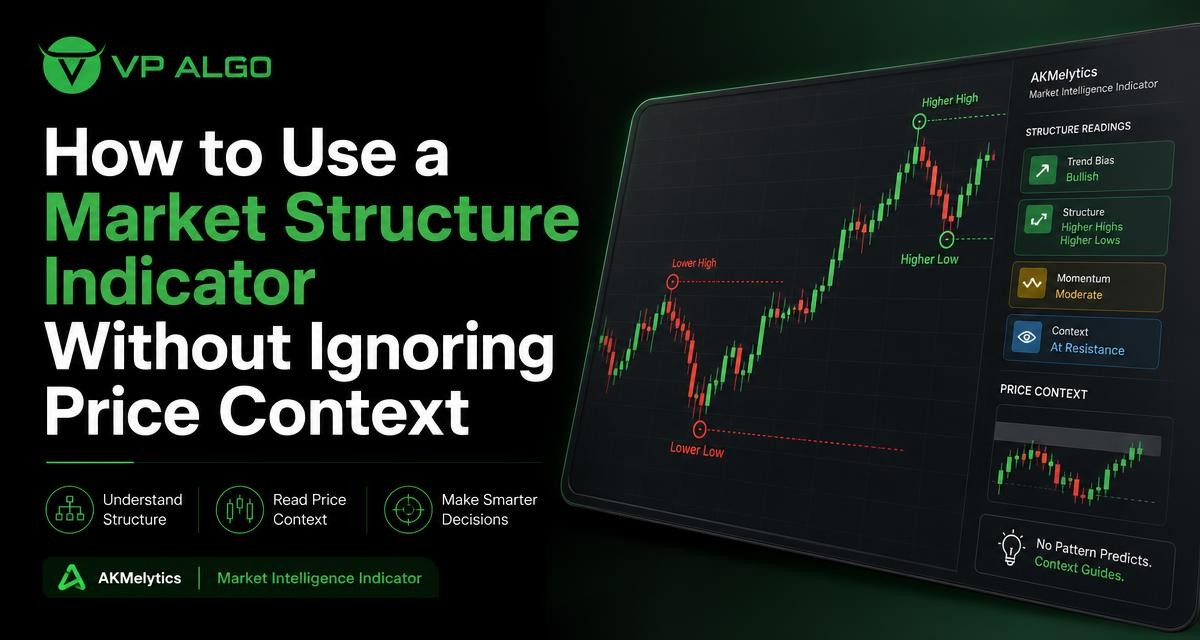
Learn how to read a market structure indicator alongside swing points, candlestick patterns, momentum and broader price context without treating any signal as a prediction.
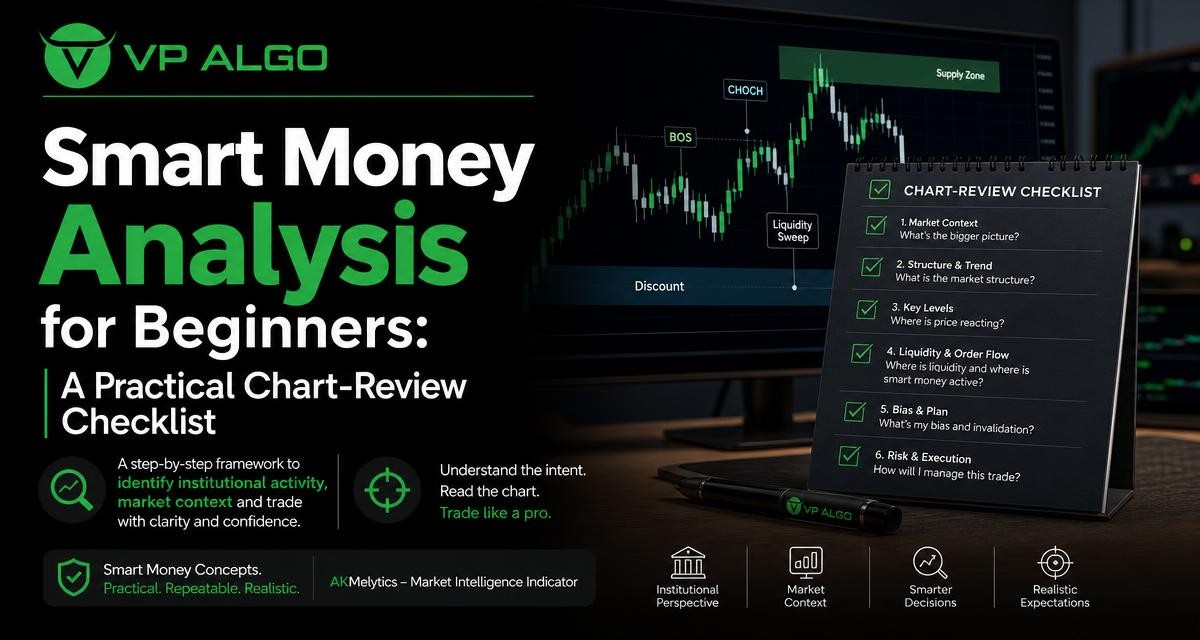
Learn how to review smart money concepts with a practical checklist covering trend, momentum, market structure, institutional activity and risk awareness.
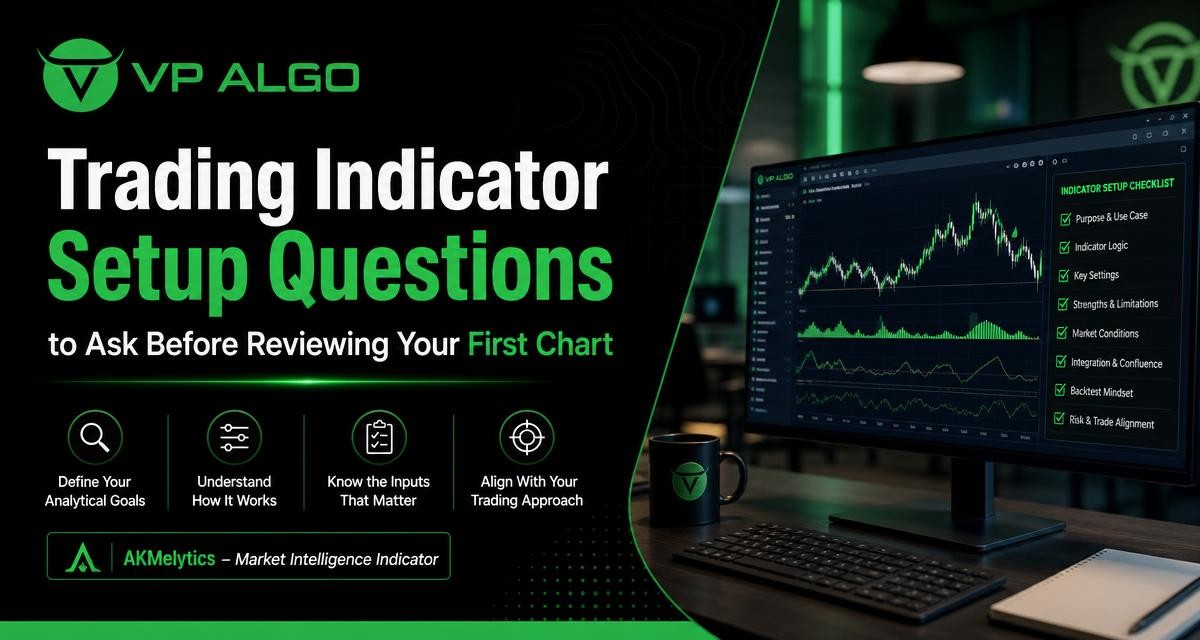
A practical guide to preparing a trading indicator, defining analytical goals, understanding its readings and reviewing charts with realistic expectations.
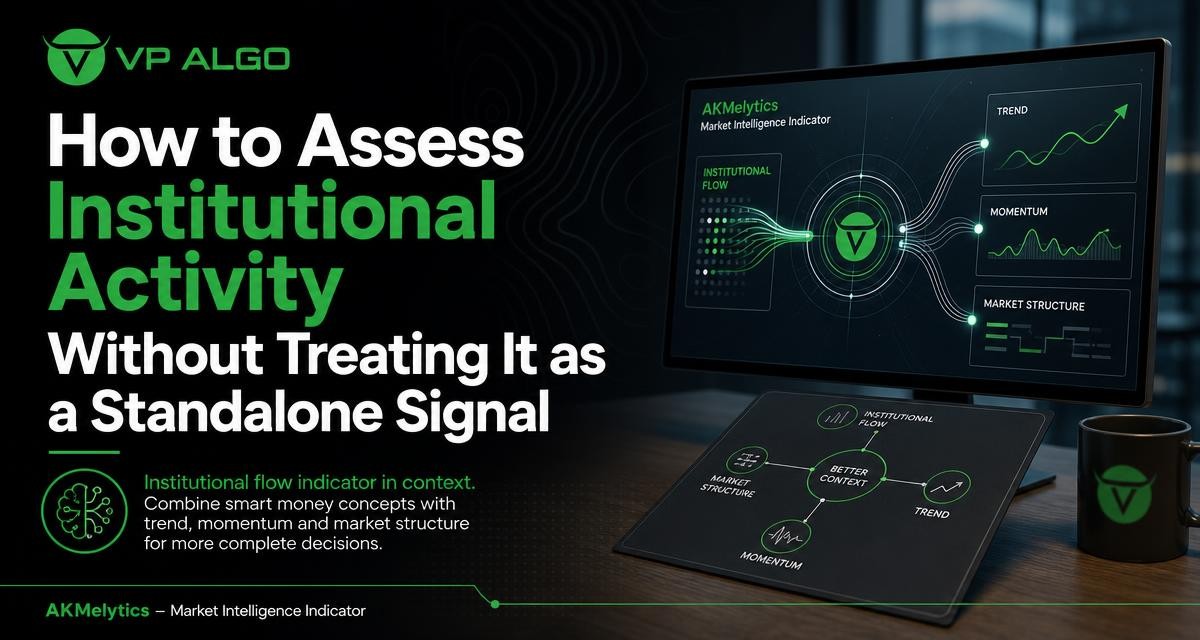
Learn how to use an institutional flow indicator alongside trend, momentum and market structure for clearer, more disciplined market analysis.
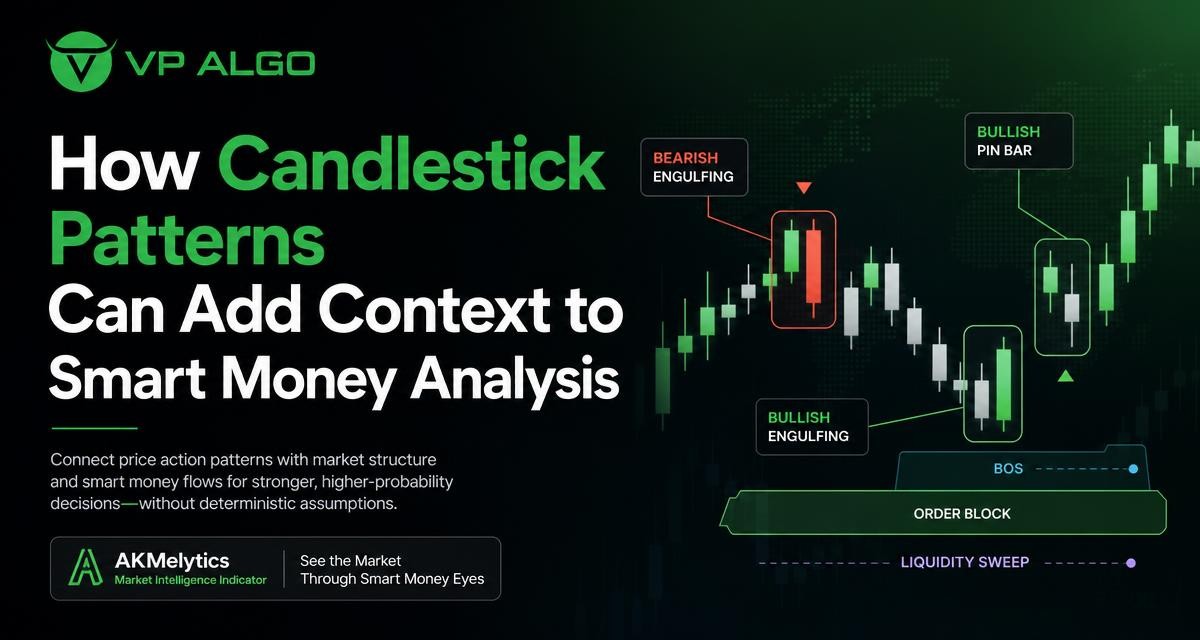
Learn how candlestick patterns can add timing and context to smart money analysis without treating individual formations as guaranteed trading signals.

Learn how to assess the best trading indicator for your workflow by comparing clarity, analytical coverage, TradingView fit and educational usefulness.


Recent Comments